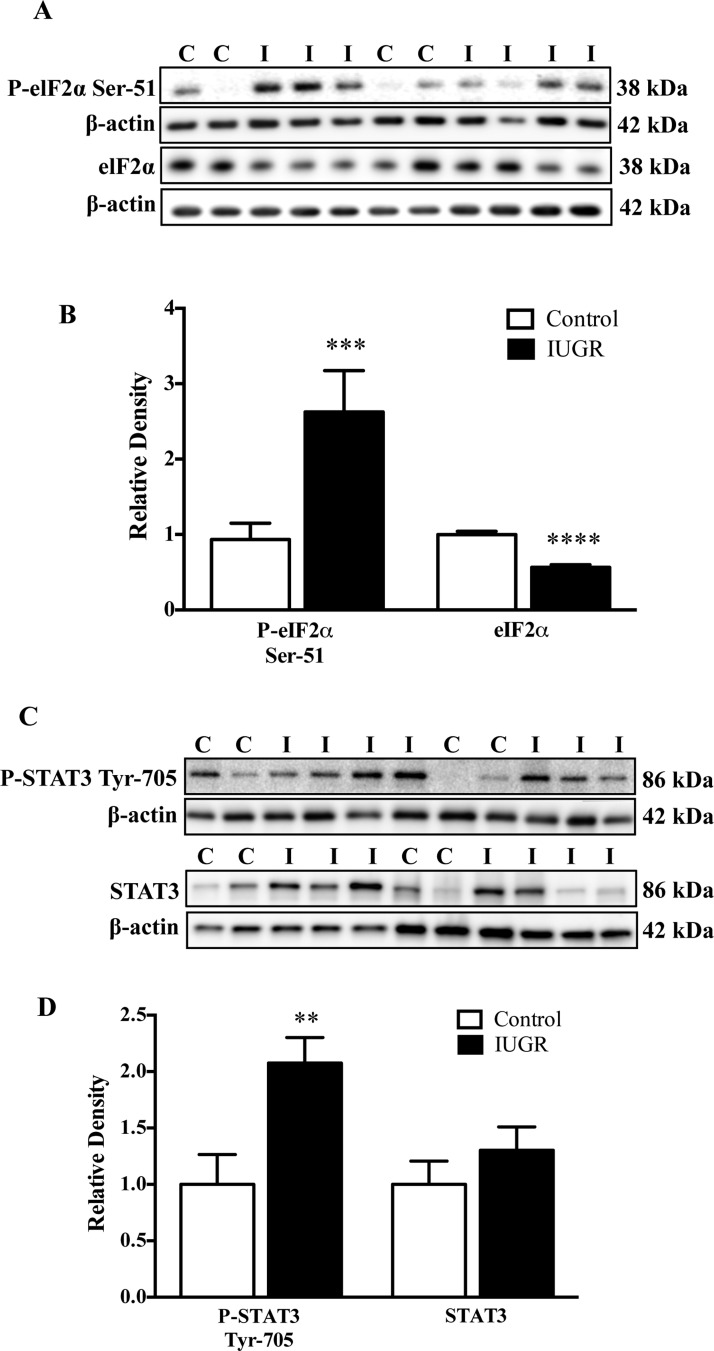
Figure 3. ER stress signalling.
(A) Representative Western blots for P-eIF2α and eIF2α. (B) Histogram summarizing the Western blots data. (C) Representative Western blots for P-STAT3 Tyr705 and STAT. (D) Histogram summarizing the Western blots data. **P<0.01, ***P<0.001 and ****P<0.0001; mean + S.E.M.; unpaired Student's t test. Abbreviations: C, control; I, IUGR.

