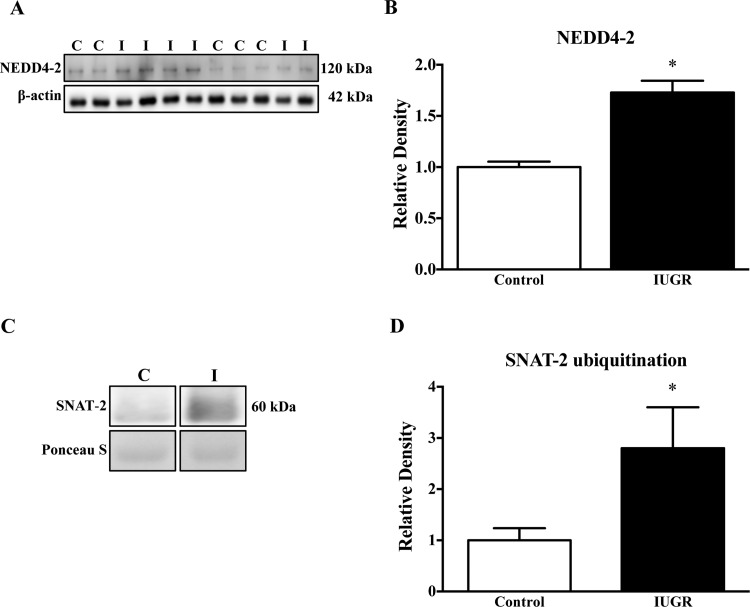
Figure 5. NEDD4-2 expression and ubiquitination of SNAT-2.
(A) Representative Western blots for NEED4-2 (B) Histogram summarizing the Western blot data. *P<0.05 compared with control; mean + S.E.M.; unpaired Student's t test. (C) Representative Western blots for SNAT-2 after immunoprecipitation for ubiquitin. (D) Histogram summarizing the Western blot data. *P<0.05 compared with control; mean + S.E.M.; non-parametric Mann–Whitney test. Abbreviations: C, control; I, IUGR.

