Figure 3.

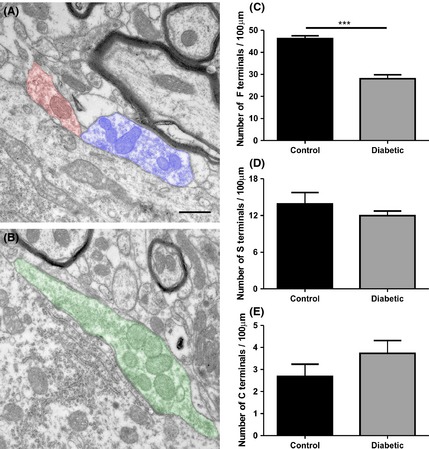
Transmission electron microscopy analysis. (A) Representative image of F terminals (orange) and S terminals (blue) obtained from a control specimen. (B) Representative image of C terminals (green) obtained from a control specimen. (C–E) Graphs of the number of F, S, and C terminals per 100 μm of cell membrane of the motoneuron. ***P < 0.001.
