
Figure 2. The ratio of long-range native (Qnat) and non-native (Qnon) contacts in the snapshot structures.
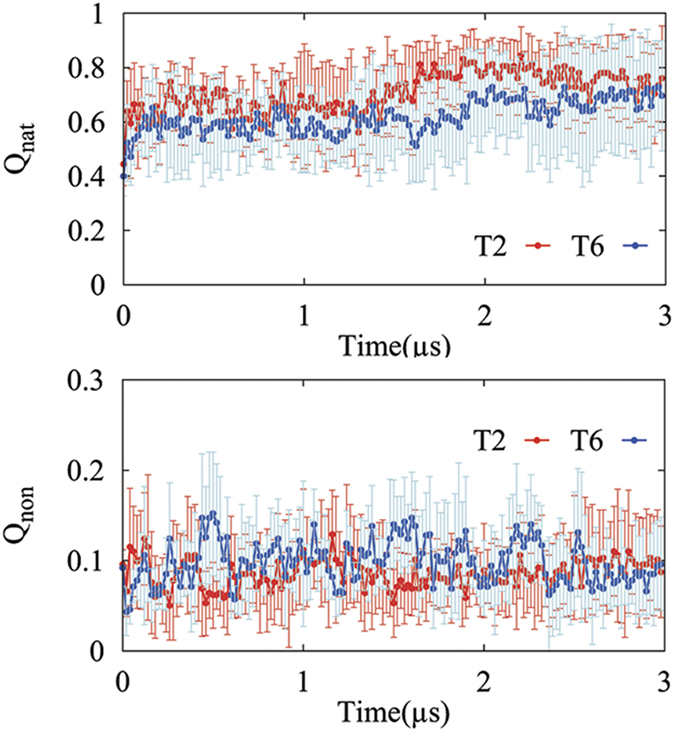
The error bar is based on the statistical data of five independent simulated trajectories for each case. T2 (red) and T6 (blue) denote the trajectories with the translation speeds of one residue per 2ns and 6ns, respectively.