
Figure 3.
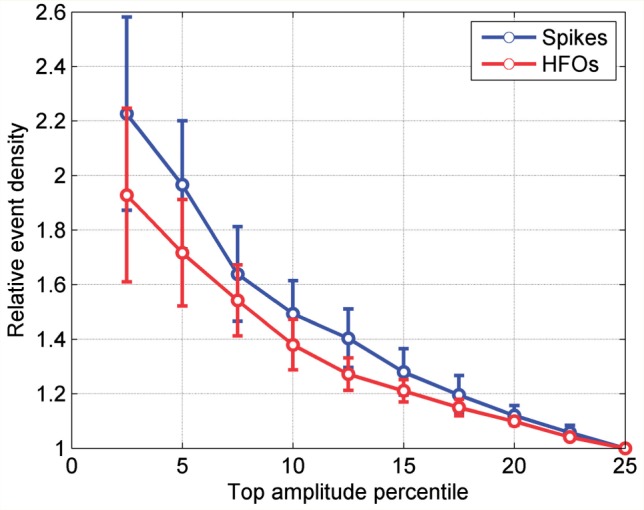
Density of spikes and HFOs as a function of the percentage of the highest amplitude slow waves analysed. The density is relative to the density found for the frontal widespread slow waves with the 25% highest amplitude. Error bars depict the standard error of the mean among the eight patients.