
Figure 4.
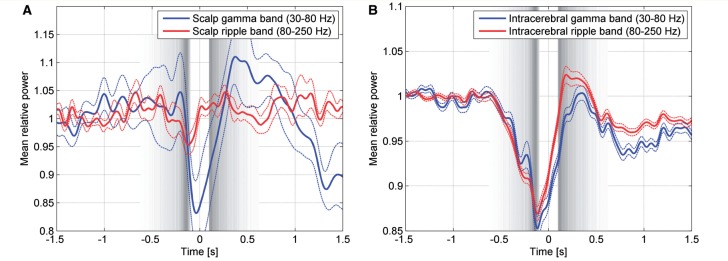
Gamma (blue line) and ripple band (red line) power for scalp channels (A) and for intracerebral channels with normal EEG activity (B). Broken lines indicate the standard error of the mean among the 16 scalp channels and the 130 intracerebral channels with normal EEG activity. Time zero corresponds to the peak of the negative half-waves, and their beginning and end are indicated by the grey bands, defined as in Fig. 2. As expected the ripple band in scalp channels is not very informative, because its amplitude is very low and hence confounded by the noise associated to the equipment (electrodes and amplifier). Of note, power in the gamma and ripple bands is higher after the negative half-wave, at the time of the cortical ‘up’ state.