
Figure 8.
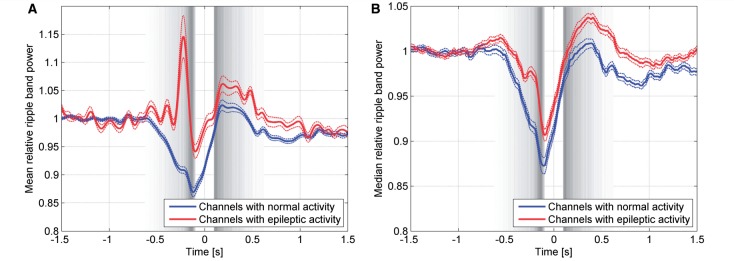
Average ripple band power distributed over channels with normal EEG activity (blue line), and channels with interictal spikes (red line). (A) The pattern of the ripple band power in intracerebral channels with normal EEG activity is different from that in channels with epileptic EEG activity, due to the presence of HFOs. (B) The median, less influenced by outliers associated with individual HFOs, shows the same general pattern in channels with normal and epileptic EEG activity. Broken lines indicate the standard error of the mean in A and standard error of the median in B among the 130 intracerebral channels with normal EEG activity and the 129 intracerebral channels with epileptic EEG activity.