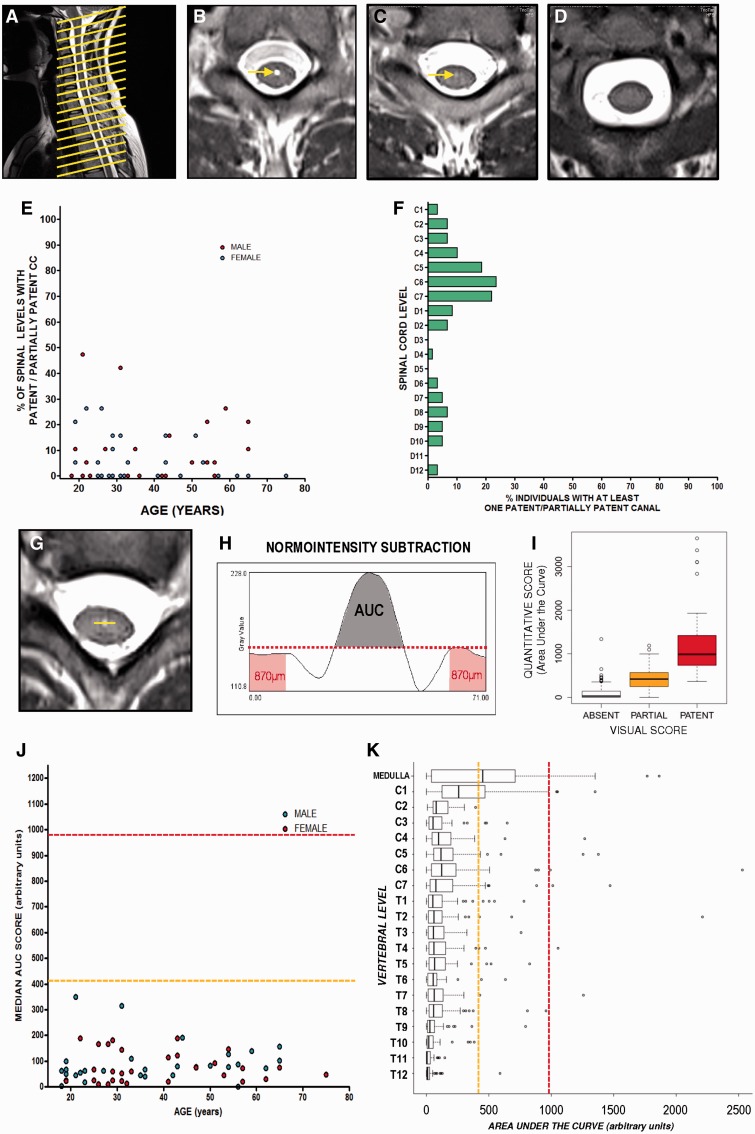
Figure 1.
Estimation of central canal patency in healthy volunteers by T2-weighted MRI. (A) Sagittal image showing the acquisition of axial planes in the spinal cord of volunteers. (B) Axial plane showing a representative level with a patent central canal (arrow). (C) Axial plane showing a representative level of a partially patent canal (arrow). (D) Axial plane showing a representative level with absence of central canal. (E) Representation of the ratio of spinal levels with a patent or partially patent central canal in each individual based on visual scoring. (F) Representation of the proportion of individuals with patent or partially patent canal at a specific spinal cord level obtained with the visual score. (G and H) Schemes depicting the protocol of quantification of central canal patency using ImageJ. (G) A line is drawn in the central grey with the centre in the coordinate corresponding to the expected position of central canal. (H) After obtaining grey intensity profile, normo-intensity is subtracted using the maximum grey intensity value in the external parts of the region of interest (red area), and area under the resultant curve (AUC, shaded region) is used as estimation of central canal patency. (I) A good equivalence is found between visual and quantitative scores. (J) Representation of median value (general score) of each individual shows a general absence of central canal patency in adult humans. Median values obtained from partially patent canals (dashed orange line) or patent canals (dashed red line) are shown as a reference. (K) Distribution of quantitative scores throughout the spinal levels of all individuals. Scores are far from the levels of patency (dashed red line) and partial patency (dashed orange line) except for low medulla and cervical level 1, where half and a quarter of individuals, respectively, present a score compatible with at least partial patency.

