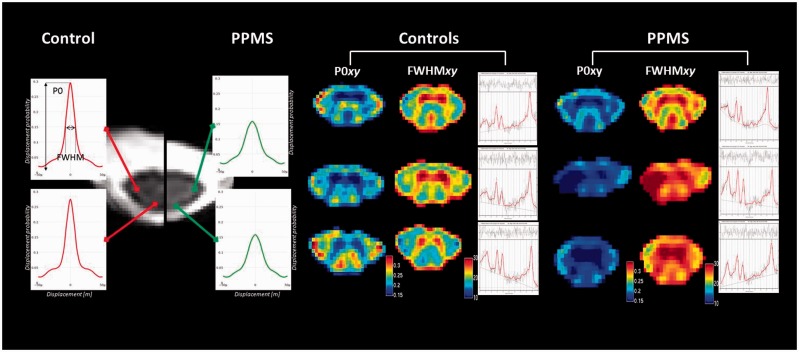
Figure 2.
Differences in spinal metabolite concentrations and perpendicular diffusivity between patients and controls. Differences in height and width of the displacement probability density function from the posterior and lateral columns between a healthy control and patient are shown on the far left. Grouped P0xy maps, FWHMxy maps and post-processed spectra from three controls (centre) and three patients (far right) demonstrate lower probability of zero net displacement (P0xy) and increased diffusion distribution (FWHMxy) in the patients. The spectra show reduced tNAA and Glx levels in the patients compared to the controls.

