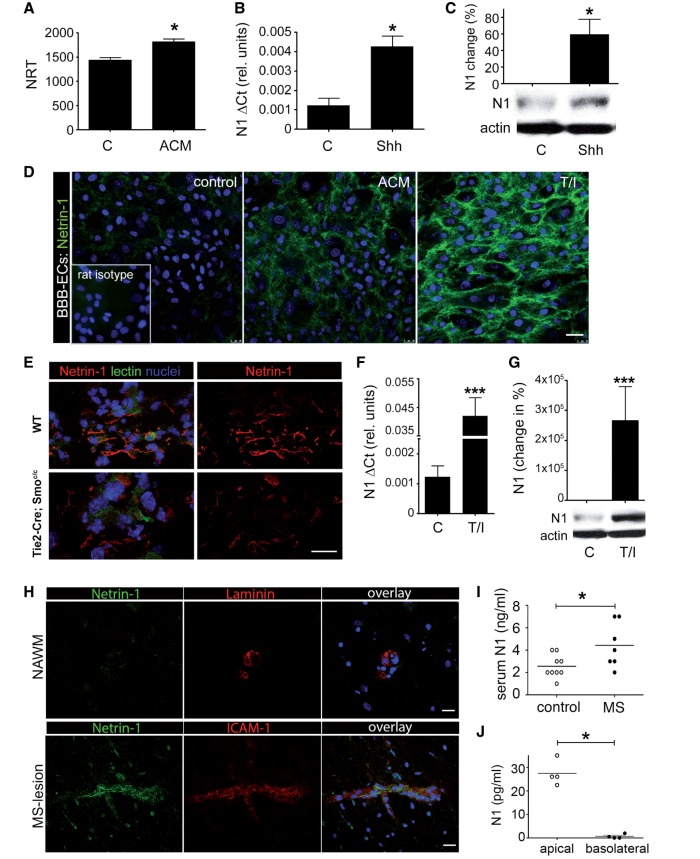
Figure 1.
Netrin 1 expression at the blood–brain barrier. Quantitative RNA sequencing analysis (A), quantitative PCR (B) and western blot (C) analyses of netrin 1 (N1) expression by primary cultures of human brain-derived endothelial cells. Endothelial cells were either untreated (control, C), or grown with either 20% (v/v) astrocyte conditioned media (ACM) or with human recombinant SHH (hrShh) (0.1 μg/ml). Netrin 1 mRNA levels are presented as the number of reads per transcript (NRT) or as the difference in cycle threshold (ΔCt) relative to actin. Netrin 1 protein levels are represented as percentile change of netrin expression compared to control brain-derived endothelial cells, normalized to 0. Representative western blots for netrin 1 are shown. All values are normalized to actin. In vitro immunocytofluorescent stainings for netrin 1 (D) (in green), on untreated (control), astrocyte conditioned media, or TNF/IFNγ (T/I) treated primary cultures of human brain-derived endothelial cells (nuclei in blue). Isotope control antibodies are shown in inserts. Netrin 1 (red) and tomato lectin (green) immunostainings (E) of CNS sections from E14 WT and smo endothelial deficient (Tie2-Cre;Smoc/c) mouse embryos. Quantitative PCR (F) and western blot (G) analyses of netrin 1 expression by primary cultures of human blood–brain barrier-endothelial cells either resting (C) or treated with T/I. In situ immunostainings for netrin 1 (H) in normal-appearing white matter (NAWM top row) and active lesions of patients with multiple sclerosis (bottom row). Co-staining for vessel marker laminin and ICAM1 (red) and nuclei (TOPRO, blue) are shown. Netrin 1 was measured by ELISA (I) in serum collected from patients with multiple sclerosis (n = 7), and healthy donors (n = 9) or in the top and bottom chamber (J) of transwells in which human astrocytes and human brain-derived endothelial cells were co-cultured. For all panels, *P ≤ 0.05; ***P ≤ 0.001. Data shown are the mean ± SEM of n = 3–5 experiments. Immunostaining panels shown are representative of 9–15 CNS sections from three patients or animals. Scale bar = 10 μm.

