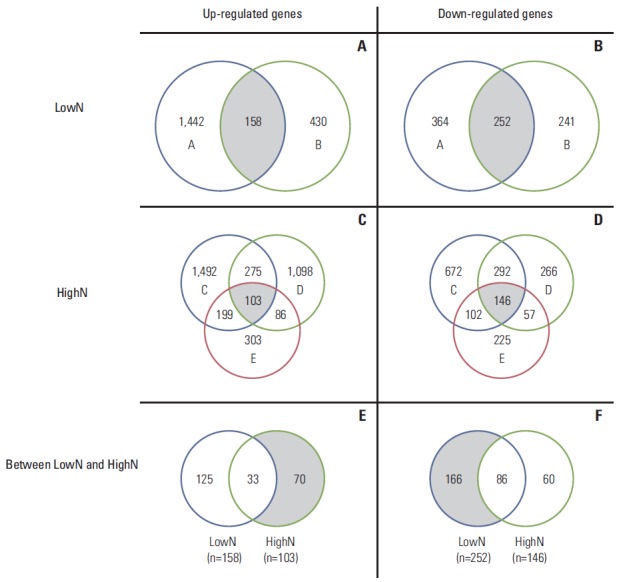
Fig. 2.

Venn diagram shows the number of specifically up-regulated genes (A) and down-regulated genes (B) in each sample of lowN, specifically up-regulated genes (C) and down-regulated genes (D) in each sample of highN, and commonly up-regulated genes (E) and down-regulated genes (F) between lowN and highN. LowN indicates patients having advanced gastric cancer (AGC) with far advanced T stage but without lymph node metastasis. HighN indicates patients having AGC with less advanced T stage with extremely high N stage.
