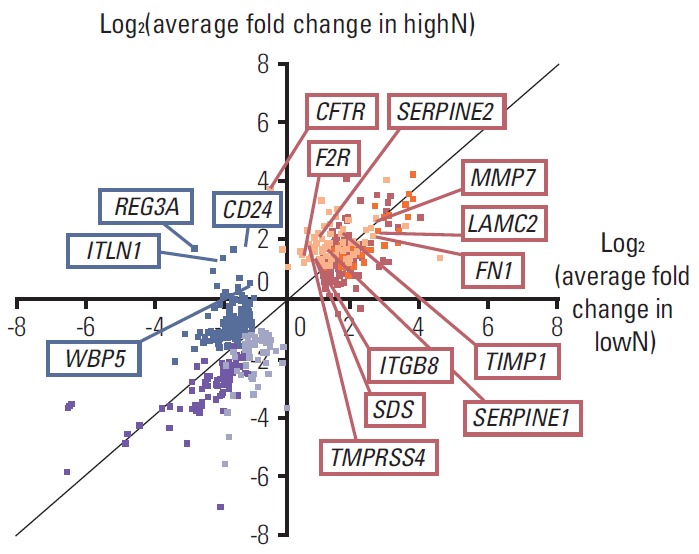
Fig. 3.

Differentially expressed genes were annotated with average fold change in the highN and lowN group. Yellow dots indicate commonly up-regulated genes in only highN and blue dots indicate commonly down-regulated genes in only lowN. HighN indicates patients having advanced gastric cancer (AGC) with less advanced T stage with extremely high N stage. LowN indicates patients having AGC with far advanced T stage but without lymph node metastasis.
