Fig. 3.

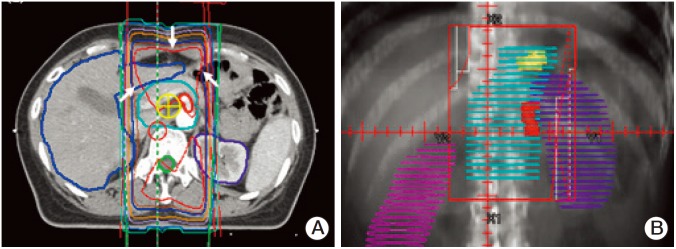
Radiation field of the 3D group. (A) Axial plane with isodose curves and 2-beam arrangement in group 2A is shown. The white arrows represents 100% isodose line in red color. (B) Beam view of the anterior beam of the 3D group is shown here.

Radiation field of the 3D group. (A) Axial plane with isodose curves and 2-beam arrangement in group 2A is shown. The white arrows represents 100% isodose line in red color. (B) Beam view of the anterior beam of the 3D group is shown here.