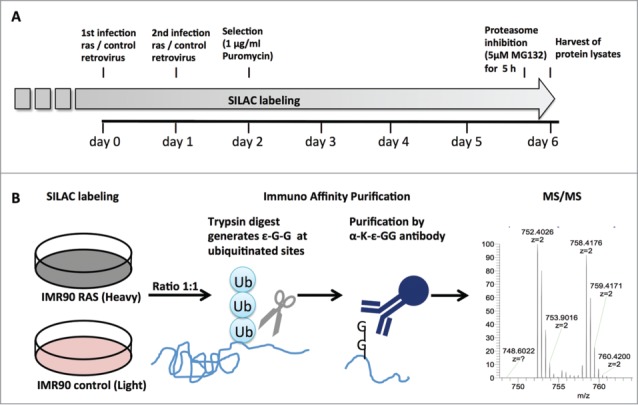
Figure 2.

Experimental setup for analysis of the OIS-associated ubiquitinome. (A) time course of RAS-induced OIS experiment. SILAC labeling of primary fibroblast (IMR90) was initiated at population doubling 20 and maintained for the duration of the experiment. Cells were infected twice with H-RASG12V or control retrovirus and selected by puromycin (1 µg/ml). Samples for mass spectrometry were collected at day 6 after a 5 h treatment with the proteasome inhibitor MG132 (5 µM). (B) Schematic of ubiquitination site identification by mass spectrometry. RAS and control fibroblasts labeled with heavy or light SILAC, respectively, cell lysates were harvested and mixed in a 1:1 ratio. Trypsin digest generated ε-G-G residues at ubiquitination site and these peptides were enriched by immune affinity purification prior to MS/MS.
