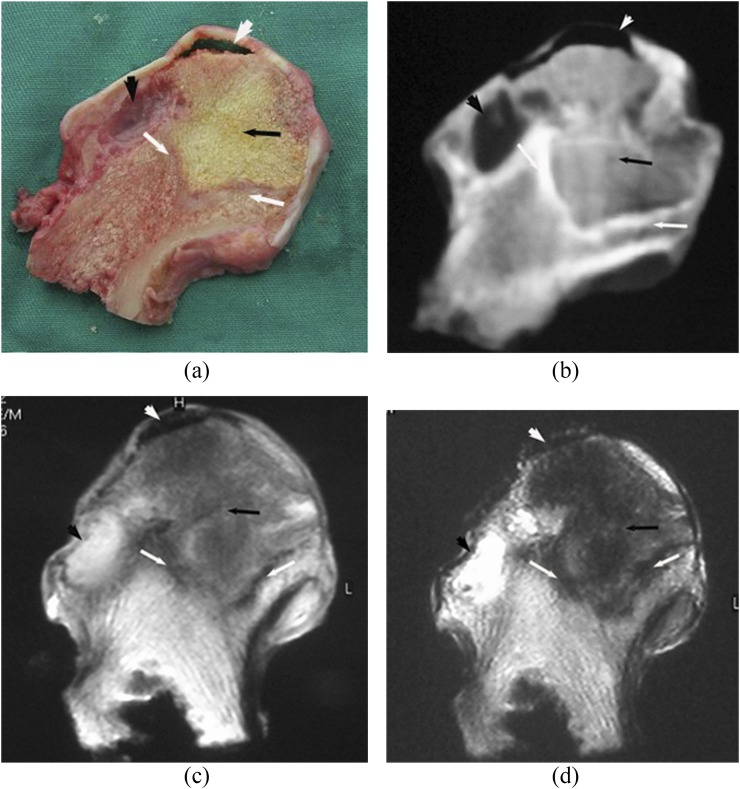
Figure 3.
Steroid osteonecrosis of the femoral head. A high degree of consistency was demonstrated between coronal section of gross specimen (a), corresponding CT sectional image (b), MR T1 weighted (T1W) (c) and T2 weighted (T2W) images (d) on the size, shape and position of necrotic lesion. Boundary region (white arrows) separated and surrounded the necrotic region (black arrows). The necrotic region was shown as isodense on CT and as low signal intensity on MR T1W and T2W images. Cystic degeneration (black arrowheads) and subchondral fracture (white arrowheads) could be seen at the edge of the necrotic region.

