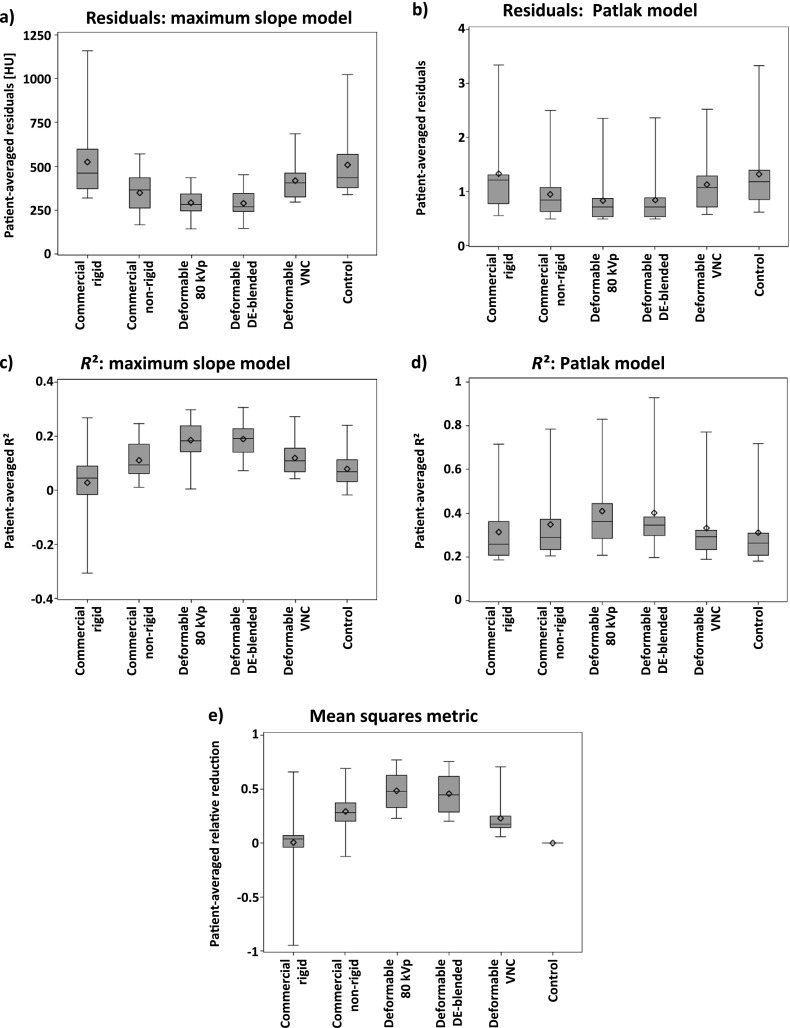
Figure 5.
Descriptive statistics of the quantitative evaluation: (a) residuals of the maximum slope model, (b) residuals of the Patlak model, (c) R2 values of the maximum slope model, (d) R2 values of the Patlak model, (e) relative reduction in metric values. Patient-wise averaging was performed to reduce the effect of different-sized regions of interest. Note the different units of the residuals, as the residual of the maximum slope model is calculated from CT values, while the residual of the Patlak model is calculated from the Patlak graph. The y-axes have been scaled differently in order to allow for visualization of subtle differences. DE, dual-energy; VNC, virtual non-contrast.

