
Figure 4.
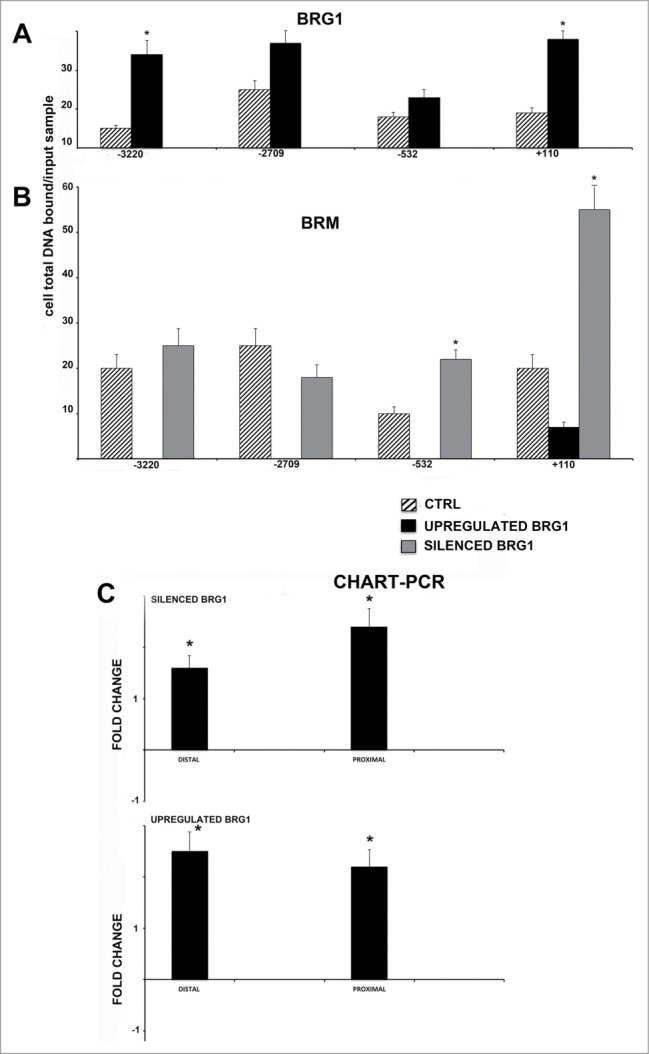
CHIP analysis of BRG1 and BRM binding on the NANOG promoter along with CHART PCR. MSC with silenced or overexpressed BRG1 was used for CHIP analysis. Panel A shows BRG1 binding on the E2F site in control cultures and in cells with silenced and overexpressed BRG1. The numbers on the X-axis refer to nucleotide positions of the identified binding sites. Panel B shows the BRM binding on the NANOG promoter in the same experimental conditions reported in A. Real-time PCR data are expressed as arbitrary units. Three biological replicates were used for each experimental condition, * P ≤ 0.05. Y axis represent cell total DNA bound/input sample according the percent input procedure described in methods. Panel C shows the CHART-PCR analysis to identify heterochromatic regions in the NANOG promoter. This assay evaluates chromatin accessibility by real-time PCR. The more the chromatin is compact, the less it is amenable to digestion by the micrococcal nuclease (MNase). Undigested DNA will provide more copies of target sequences for PCR amplification. We amplified 2 regions (Proximal and Distal) of the NANOG promoter following treatment of DNA with MNase. The upper graph shows results in cells with silenced BRG1. In these cells, the level of amplified DNA, representing heterochromatic DNA, was compared with the control MSC cultures. Changes in the heterochromatic DNA level are expressed as fold changes. The lower graph shows the same analysis in cells with overexpressed BRG1. Three biological replicates were used for each experimental condition, * P ≤ 0.05.