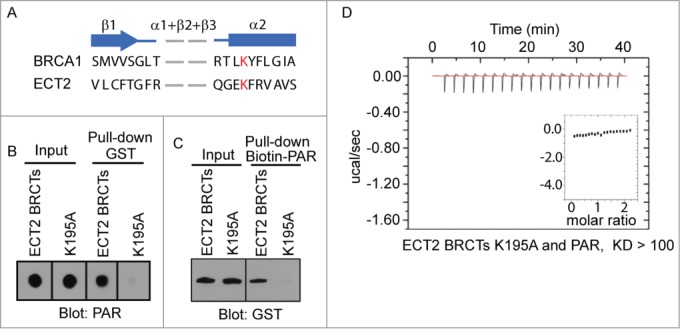
Figure 2.

PAR binding site in ECT2 BRCTs. (A) Secondary structure comparison between BRCA1 BRCTs and ECT2 BRCTs shows the conserved binding pocket for phosphate group. β strand is shown as arrow and α helix is shown as box. Conserved residues are marked in red. (B) The interaction between PAR and GST-ECT2 BRCTs (positive control), or GST-ECT2 BRCTs K195A was examined by GST pull-down and dot blotted with anti-PAR antibody. PAR was blotted and shown as the input. (C) The interaction between biotin-PAR and the recombinant proteins in (A) was examined by the reciprocal pull-down with Streptavidin beads and blotted with anti-GST antibody. Recombinant proteins were blotted and shown as the input. (D) The affinity between PAR and GST-ECT2 BRCTs K195A was measured by ITC. Titration of PAR was injected into a solution containing the purified protein. The inset shows the fit of the data to an equilibrium binding isotherm. The fit provides an equilibrium dissociation constant (KD) for the binding of PAR to the protein.
