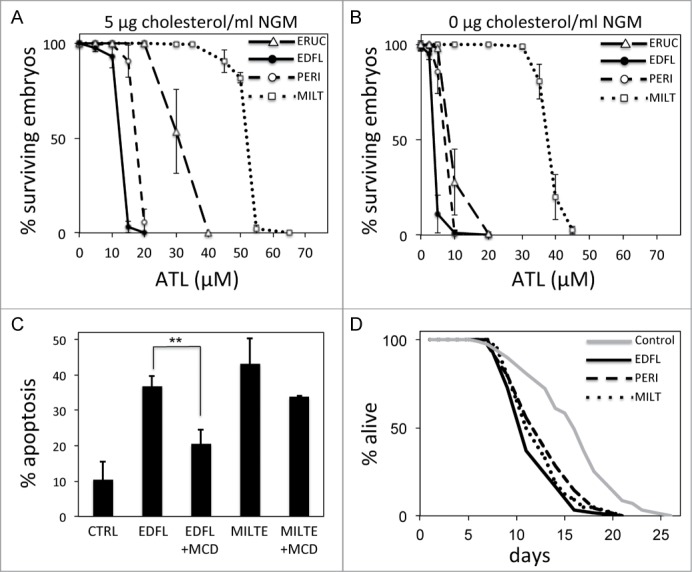
Figure 6.

Comparative efficiency of different ATLs. (A) Percentage of surviving embryos laid by worms treated with different concentrations of ATLs when NGM plates are supplemented with 5 μg of cholesterol/ml of medium. Each data point represents the mean values ± SD of at least 3 independent experiments (see Table S3 for details). (B) Percentage of surviving embryos laid by worms treated with different concentrations of ATLs when NGM plates are prepared without cholesterol. Each data point represents the mean values ± SD of at least 3 independent experiments (see Table S4 for details). (C) Edelfosine versus miltefosine-induced apoptosis of human tumor Z-138 cells in the presence or absence of the cholesterol sequester methyl-β-cyclodextrin. Z-138 cells were untreated or pretreated with 2.5 mg/ml MCD and then incubated in the absence or in the presence of 10 μM edelfosine or 40 μM miltefosine for 24 hours. The percentage of apoptotic cells was determined by flow cytometry. Data shown are means ± SD of tree independent experiments (**P < 0.01, Student's t test). (D) Lifespan curves for worms treated with edelfosine, perifosine or miltefosine compared to control (untreated) worms. Life spans were done at 20°C and using standard NGM plates supplemented with the respective ATL at the following concentrations: perifosine = 17.5 μM; edelfosine = 12.4 μM; and miltefosine = 52 μM (see Table S5 for details). y-axis indicates % of worms that are alive. x-axis indicates day of adulthood.
