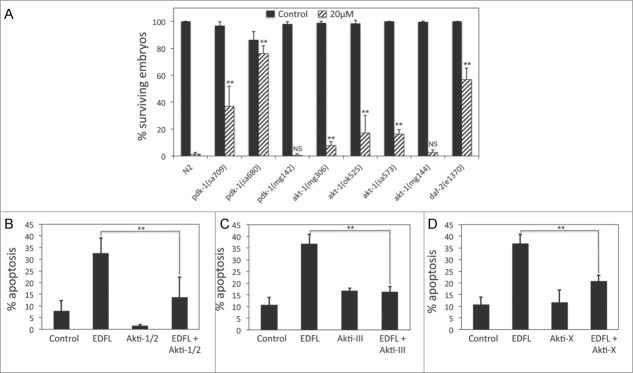
Figure 7.

Inhibition of IIS pathway activity leads to edelfosine resistance in C. elegans and in human tumor cells. (A) Percentage of surviving embryos (n ≥ 250 per treatment) laid by L3-L4 N2 control worms as well as pdk-1, akt-1, or daf-2 mutant worms untreated or treated with 20 μM edelfosine. Each bar in the histogram represents the mean values ± SD of at least 3 independent experiments. (**P < 0.01; NS P > 0.05, Student's t test). (B) ZZ-138 cells were preincubated without or with 1 μM Akti-1/2 for 1 h, then incubated in the absence (control) or presence of 10 μM edelfosine for 24 hours and analyzed by flow cytometry to evaluate apoptosis. Data shown are means ± SD of 3 independent experiments (**P < 0.01, Student's t test). (C) Z-138 cells were preincubated without or with 10 μM Akti-III and then incubated in the absence (control) or presence of 10 μM edelfosine for 24 hours, and analyzed by flow cytometry to evaluate apoptosis. Data shown are means ± SD of 3 independent experiments (**P < 0.01, Student's t test). (D) Z-138 cells were preincubated without or with or 5 μM Akti-X for 1 h, and then incubated in the absence (control) or presence of 10 μM edelfosine for 24 hours, and analyzed by flow cytometry to evaluate apoptosis. Data shown are means ± SD of 3 independent experiments (**P < 0.01, Student's t test).
