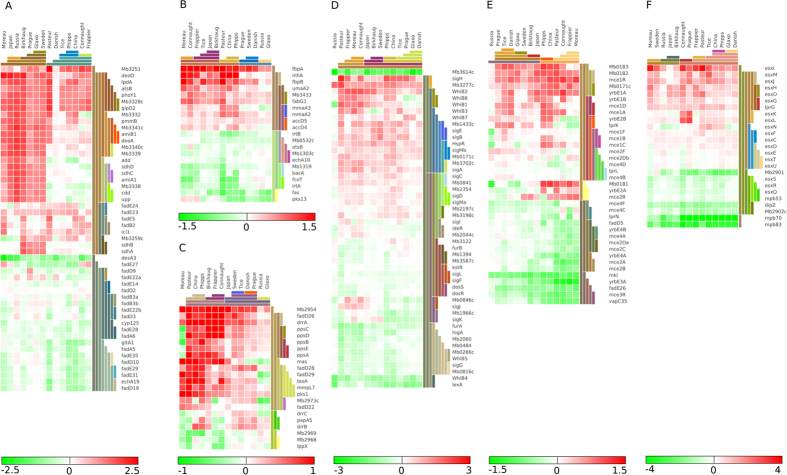
Figure 3. Transcriptional profile of a global collection of BCG strains: Gene expression heat maps of genes showing expression profiles involved in;
(A) Catabolism of fatty acids. (B) phenolpthiocerol dimycocerosate (PDIM). (C) mycolic acid synthesis. (D) Transcriptional regulatory. (E) Mammalian cell entry genes. (F) Immunogenic surface and secreted proteins. Genes were selected based on their annotation. The color scales represent log2-fold changes in gene expression (DESeq), using the M. bovis AF2122/97 strain as reference.

