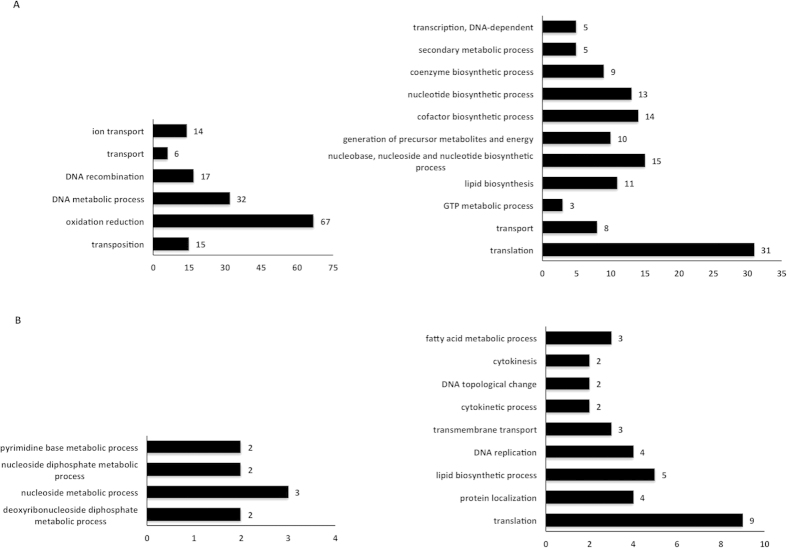
Figure 4. Pattern of increased and decreased expression in genes of BCG Japan and Danish compared to our own assembled genome of BCG Russia.
(A) Genes that are significantly down-regulated or up-regulated in BCG Japan compared to BCG Russia. Genes are categorized based on significant enrichment in biological processes of gene ontologies (p < 0.05). Left: total number of genes found to be down-regulated in each biological process category. Right: total number of genes found to be up-regulated in each biological process category. (B) Genes that are significantly down-regulated or up-regulated in BCG Danish compared to BCG Russia. Genes are categorized based on significant enrichment in biological processes of gene ontologies. Left: total number of genes found to be down-regulated in each biological process category. Right: total number of genes found to be up-regulated in each biological process category.

