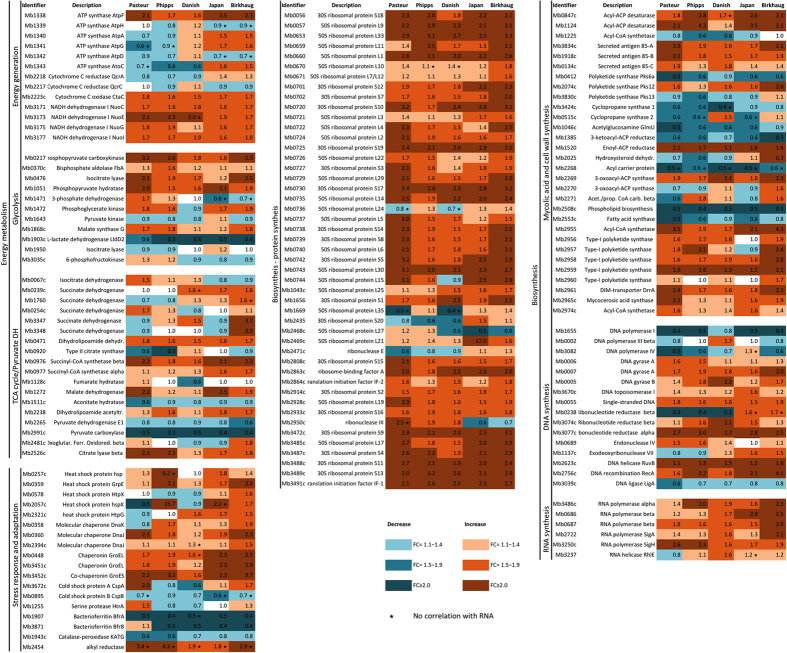
Figure 5. Heat map of differentially expressed proteins among five representative BCG strains compared to M. bovis.
Differential expression of proteins involved in biochemical pathways related to energy metabolism (A), or to biosynthesis pathways (B,C) are shown. The color scale indicates differential regulation as the Fold Change of the protein amount relative to the M. bovis 2122/97 reference strain. Up-regulation is indicated in red, down-regulation in blue. Star (*) indicates lack of correlation with RNA-seq data for that gene.

