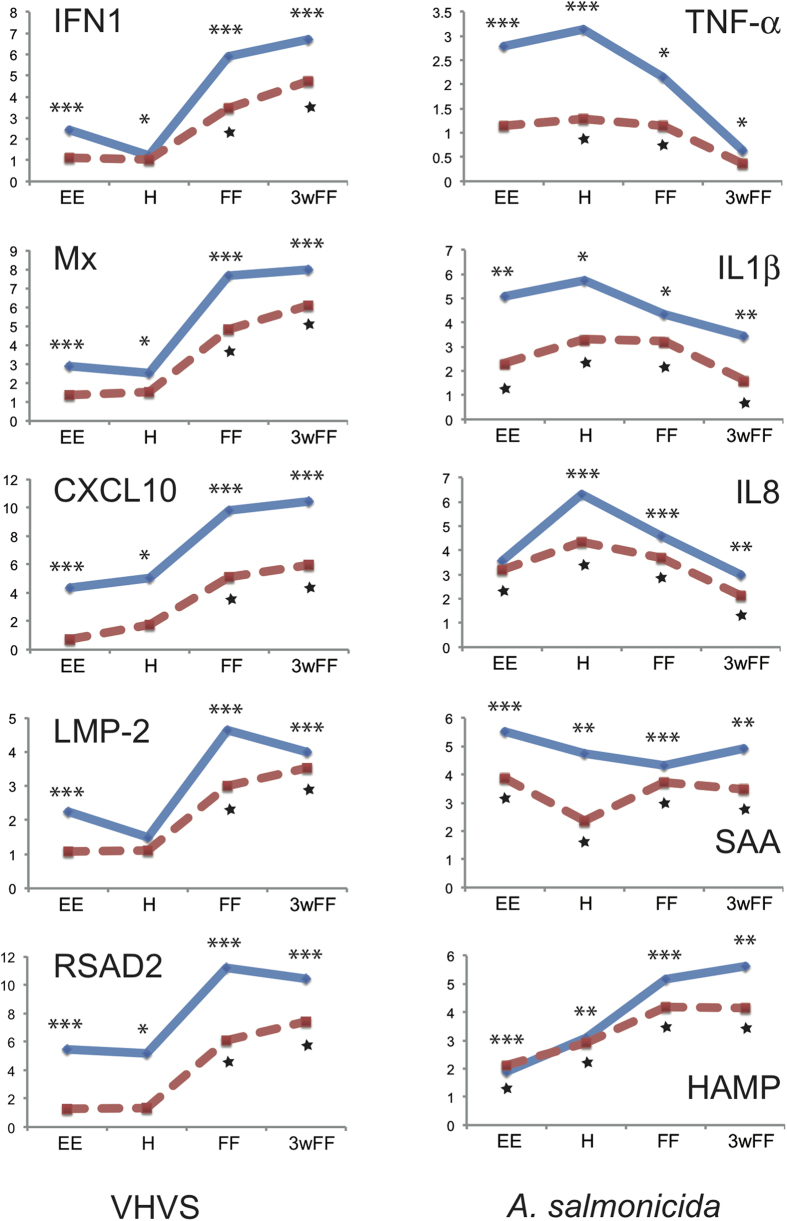
Figure 3. Comparison between transcriptomics responses of selected genes measured by micro-array (red dotted line) and by real time PCR (blue solid line).
Data are represented as Log2ratios of expression levels (infected/control). The complete qPCR dataset is in Table S3. Significant difference between infected and control fish are denoted by * for qPCR (*p < 5%; **p < 1%; ***p < 0.1%) and by ⋆ for micro arrays. For all ANOVA tests on qPCR results, the assumptions of normality and homoscedasticity were evaluated on model residuals using the Anderson-Darling and Levene’s tests, respectively. When data did not conform to these expectations, transformations were tested, including the Box-Cox and double square root. Data that deviated strongly from normality and homoscedasticity, even after trialling multiple transformations, were analysed using a nonparametric Kruskal-Wallis test. The qPCR data analysis is detailed in Supplementary method.

