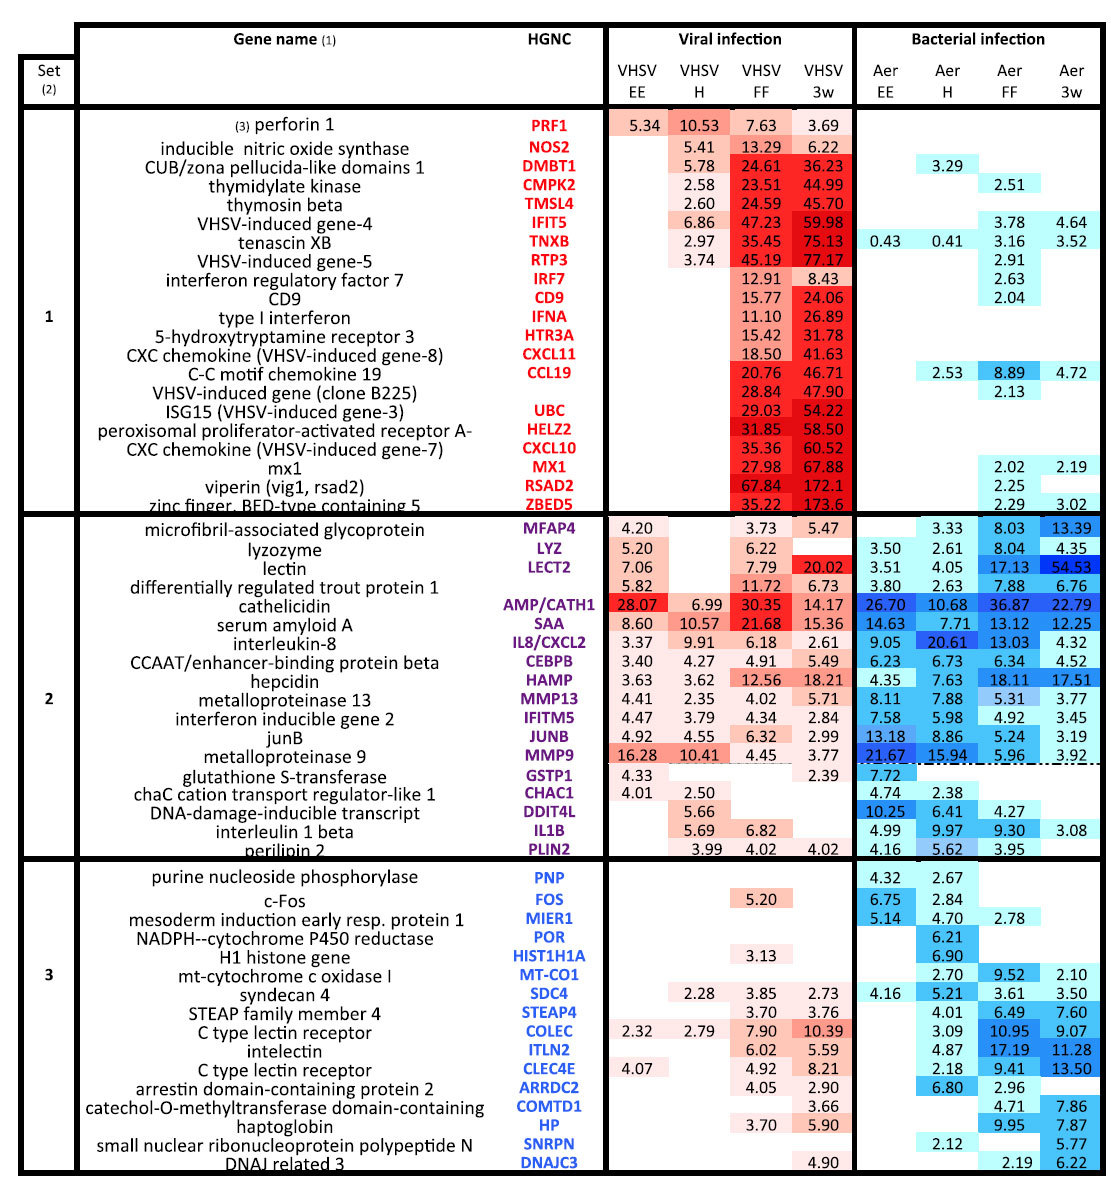
Table 1. Top up-regulated genes after VHSV and A. salmonicida infection show pathogen-specific expression patterns.

(1) Lists of the top up-regulated genes after viral or bacterial infection were produced by collecting probes induced with the 20 highest fold change (»top20») values at the different developmental stages. The list was manually curated to keep distinct genes with available functional annotation.
(2) HGNC of genes only present in the top up-regulated list after viral infection are in red (set1); the intersect of the lists of the top up-regulated genes by viral and by bacterial infection has HGNC in purple (set2) HGNC of genes onlypresent in top up-regulated list after bacterial infection are in blue (set3).
(3) The order of probes was optimized to depict the dynamics of the response across development, from probes induced only at early stages to probes induced at all stages, and finally to probes induced only at later stages; the reference being the viral infection (set1), the bacterial infection (set3) or both (set2), according to the distribution of the “top20” genes. FC values after viral and bacterial infection are highlighted as heatmaps (red after VHSV, blue after A. salmonicida) that reveal expression patterns emerging when probes are classified in this way.
