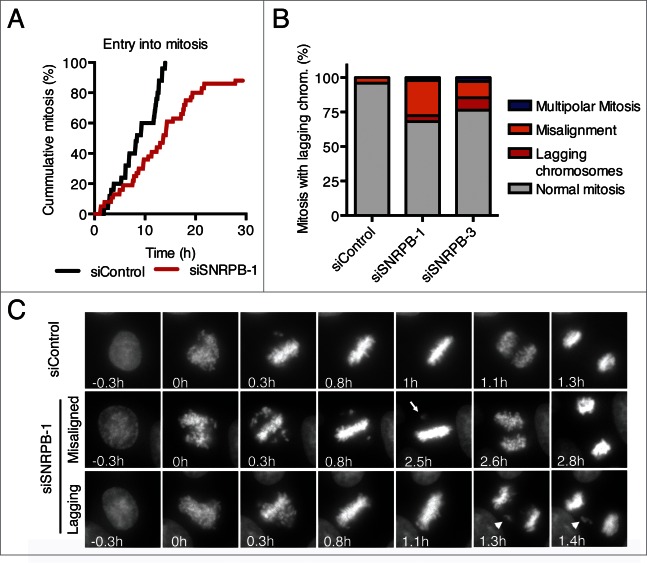
Figure 4.
Spliceosome depletion also results in mitotic defects. (A) HeLa H2B-GFP cells were transfected with the indicated siRNAs (1 nM), and live cell imaging was performed starting at 24 h after siRNA transfection. Cumulative frequency of cells entering mitosis during the time lapse is shown. (B) Quantification of the mitotic phenotypes observed in (A). (C) Representative micrographs of the time lapse imaging in (A). Nuclear envelope breakdown (NEBD) is set as time 0 h. Arrow points to a misaligned chromosome. Arrowhead marks a lagging chromosome.

