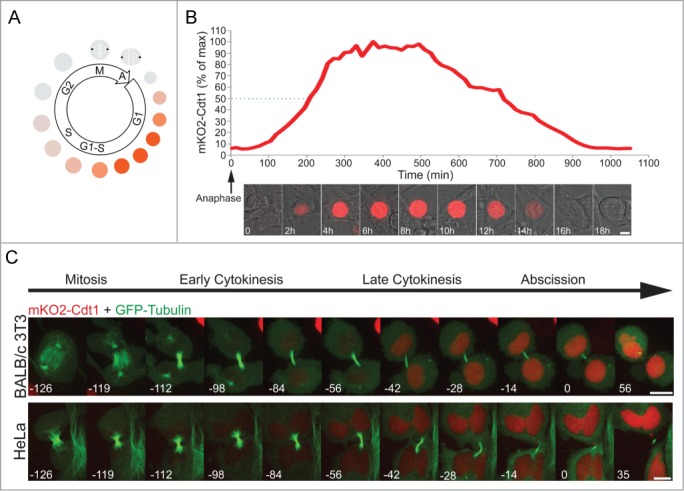
Figure 1.

Recording abscission in G1. (A) Schematic representation of Cdt1 oscillation in proliferating cells. Cdt1 degron fused to a fluorescent tag is a well-established marker of G1. The fusion protein accumulates and peaks at G1. Reduction in Cdt1 levels, as mediated by the SCFSkp2 E3 ligase, is a hallmark of S-phase entry. (B) Live-cell imaging of BALB/c 3T3 cells stably expressing mKO2-Cdt1 undergoing a complete cell cycle. Plot indicates relative Cdt1 levels [percent of maximum (max) signal] as a function of time. Measurements were taken every 15 min. Time 0 was set at anaphase. Quantification and representative images of the movie sequence of Movie S1 are shown. Dashed line marks 50% of maximum Cdt1 levels. Scale bar = 10 μm. (C) HeLa and BALB/c 3T3 cells stably expressing mKO2-Cdt1 and transfected with GFP-tubulin, were imaged during cell division. Time 0 was set at abscission completion, i.e., intercellular bridge cutting. Images were taken every 7 min. Scale bar = 10 μm.
