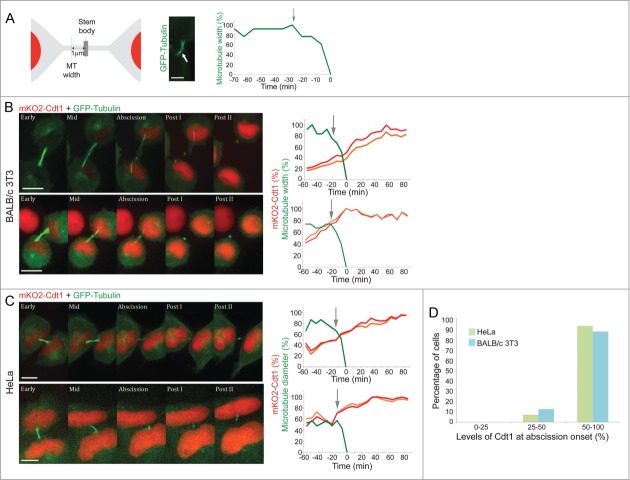
Figure 2.
Cell abscission commences in G1. (A) Measuring abscission onset in live cells. Microtubule width was measured based on the intensity profile of a line crossing the intercellular bridge at the narrowest point along the bridge. This point (indicated by a white arrow in a representative HeLa cell expressing GFP-Tubulin; scale bar = 5 μm) is about 1 μm away from the center of the bridge (see illustration). The relative microtubule width (percentage of maximum width [%]) at this point is plotted over time (see plot). Abscission onset was set at the time of acute decrease in microtubule width at the first abscission site (depicted in the plot by an arrow). (B and C) BALB/c 3T3 cells (B) or HeLa cells (C) stably expressing mKO2-Cdt1 were transfected with GFP-tubulin and imaged during late cytokinesis at 7 min intervals. Time 0 was set at intercellular bridge cutting. Representative images of different stages during late cytokinesis (early, mid, abscission) and post-abscission (posts I and II) are shown on the left (movie series are available in Movies S2–5). Graphs on the right indicate the mKO2-Cdt1 levels in the 2 newly formed daughter cells (red and orange lines) and the diameter of the microtubules that accommodate the intercellular bridge connecting the cells. mKO2-Cdt1 levels are provided as percentages of maximum intensity (%), i.e., relative to mKO2-Cdt1 level at plateau. Arrows indicate the beginning of abscission. Scale bar = 10 μm. (D) HeLa (green) and BALB/c 3T3 (blue) cells were categorized according to the relative level (% of maximum) of mKO2-Cdt1 at the time of abscission onset (n = 16). The fraction of cells whose relative mKO2-Cdt1 level exceeded 50% at abscission onset was significantly larger (χ22 test; p = 0.005 for HeLa cells and p = 0.03 for BALB/c 3T3 cells).

