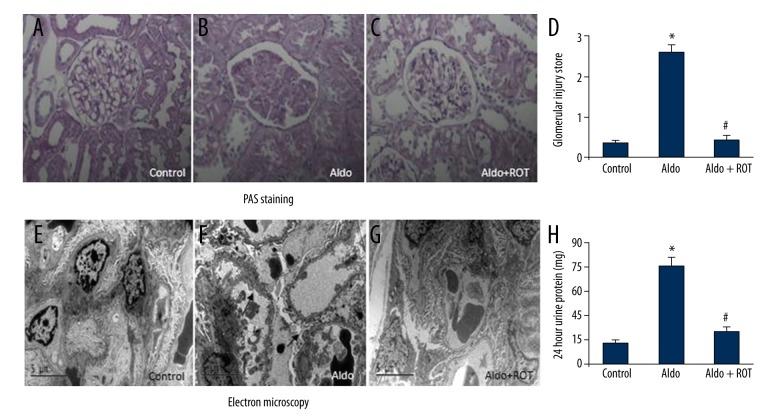
Figure 1.
ROT attenuated kidney damage in Aldo-infused rats. Representative photomicrographs (magnification ×400) of PAS-stained kidney sections (A–D). Morphology changes of podocyte foot processes by electron microscopy (E–G; magnification ×5800). Arrow indicates podocyte foot process effacement. Twenty-four hour urine protein was measured at week 4 (H). Data are expressed as means ±SEM (n=6). * P<0.05, control versus Aldo-infused rats; # P<0.05, Aldo-infused rats versus Aldo + ROT treatment rats.

