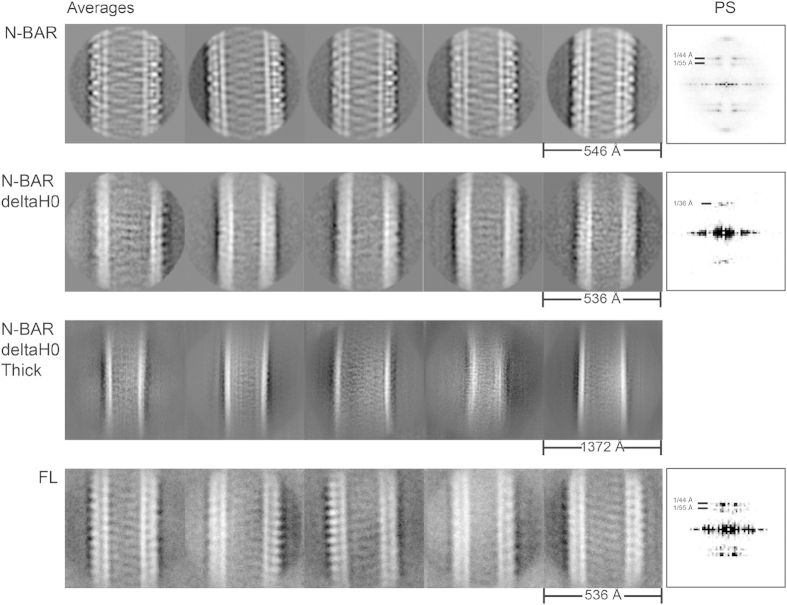
Figure 2. Left: Five representative 2D averages of tubes remodeled by N-BAR (first row), N-BAR-deltaH0 (second row), N-BAR-deltaH0 tubes with thicker size (third row), and FL (fourth row).
For the N-BAR averages (first row, left to right), 1365, 1392, 1173, 692 and 1372 particles were used. The class averages of N-BAR-deltaH0 (second row, left to right) contain 234, 312, 165, 185 and 132 particles and 159, 403, 118, 282 and 447 particles for the thick class averages (third row, left to right). For FL (forth row, left to right) 398, 293, 284, 459 and 466 particles were used. Right: Power spectra of the most left 2D class averages. The 2D averages of N-BAR and FL reveal the organized protein assembly and the corresponding power spectra show periodical signal pattern of 44 and 55 Å corresponding to striped patterns within the tubes. N-BAR-deltaH0 reveals a spacing of ~36 Å and no interwoven pattern, indicating the protein assembly being not as rigid as in N-BAR mediated tubes and the change of the protein assembly.

