Figure 1.
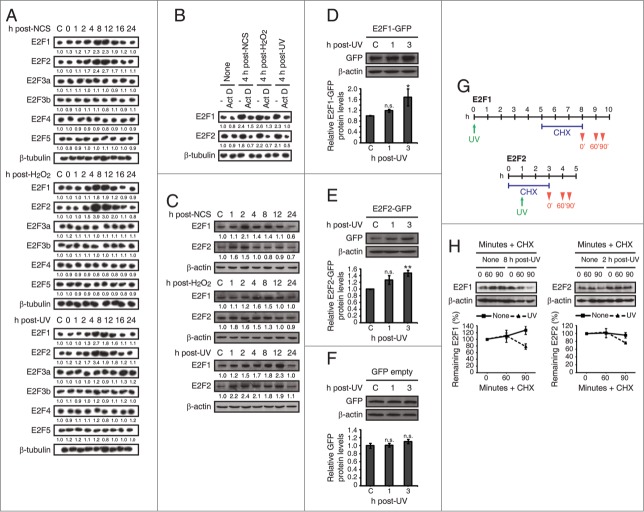
E2F1 and E2F2 mRNA and protein levels increase following DNA damage in neuronal cells. (A and B) Northern blot analysis of SH-SY5Y cells treated with NCS, H2O2 or UV and harvested at the specified times. Total RNA was extracted from cells and subjected to Northern blot with the [32P]-labeled probes shown in the left margin. In (B), cells were pre-incubated 3 h with 1 μM actinomycin D (Act D). The numbers under the bands indicate E2F1–5 quantitation normalized to β-tubulin and control in (A), and E2F1 and E2F2 quantitation normalized to β-tubulin and None (-) condition in (B). (C) Western blot of E2F1 and E2F2 in SH-SY5Y cells treated with NCS, H2O2 or UV and harvested at the indicated times. The numbers under the bands indicate E2F1 and E2F2 quantitation normalized to β-actin and control. (D–F) Immunoblot of GFP in SH-SY5Y cells expressing E2F1-GFP (D), E2F2-GFP (E) or pEGFP-C1 empty vector (F) and harvested at the indicated times post-UV. (G and H) Western blot of E2F1 and E2F2 in SH-SY5Y cells pre-incubated 3 h with 10 μM cycloheximide (CHX) and harvested at the specified times after genotoxic treatment, as shown in (G). In (D–F, H), data represent the mean±S.E.M. of at least 4 independent experiments for (D and E) and n = 3 for (F and H). In (D–F), P-values were calculated by one-way ANOVA, Dunnett's: *P < 0.05, **P < 0.01, n.s. not significant. C, control mock-treated cells.

