Figure 4.
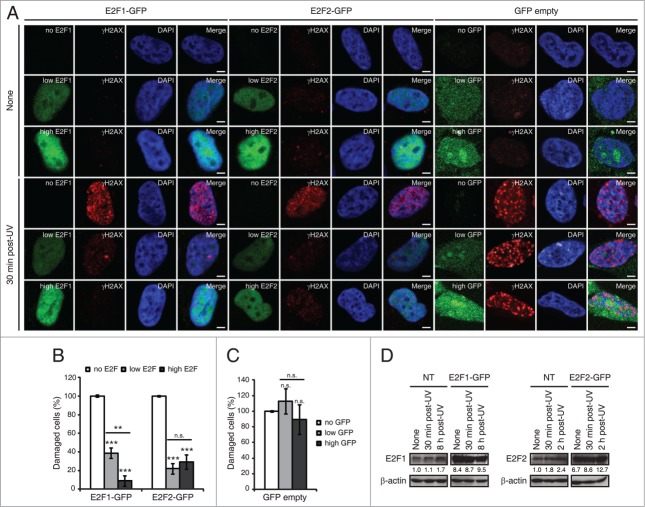
E2F1 and E2F2 upregulation reduces γH2AX intensity following UV irradiation. (A) SH-SY5Y cells expressing E2F1-GFP, E2F2-GFP or pEGFP-C1 empty vector, fixed 30 minutes post-UV and immunostained with anti-γH2AX antibody. Nuclei were visualized with DAPI staining. Scale bar, 10 μm. (B and C) Percentage of damaged cells obtained by measurement of γH2AX intensity levels. Quantifications were carried out classifying cells according to the E2F expression level: no E2F, low E2F or high E2F in (B), or to the GFP expression level: no GFP, low GFP or high GFP in (C). Results are expressed relative to mock-treated no E2F condition in (B) or mock-treated no GFP condition in (C), which represent the 10% of the maximum γH2AX intensity detected, and UV treatment was normalized to mock-treatment for each of the E2F (B) or GFP (C) intensity levels. Data represent the mean±S.E.M. of at least 4 independent experiments, in which 250 to 400 cells were analyzed for each condition. P-values were calculated by one-way ANOVA, Tukey's: **P < 0.01, ***P < 0.001, n.s. not significant. (D) Immunoblot of E2F1 or E2F2 in SH-SY5Y cells transfected with E2F1-GFP or E2F2-GFP respectively, and in control not transfected (NT) cells. Cells were harvested at the indicated times post-UV. E2F bands correspond to the endogenous protein in NT and to the exogenously expressed protein in E2F-GFP. The numbers under the bands indicate E2F1 and E2F2 quantitation normalized to β-actin and NT-None condition.

