Figure 7.
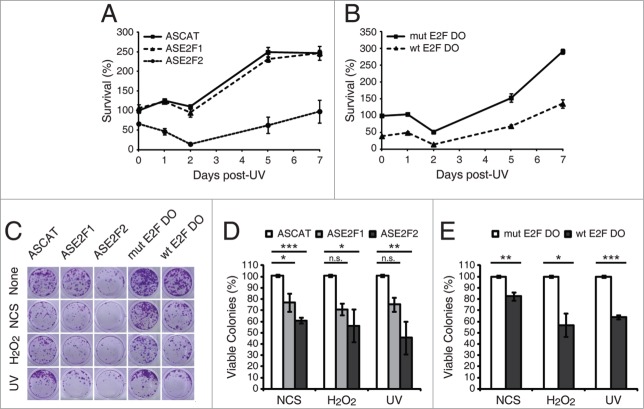
E2F1 and E2F2 confer cellular resistance to genotoxic stimuli. (A and B) Cell survival assessed by MTT reduction assay in SH-SY5Y cells transfected with 1 μM of the specified ODN and exposed to UV irradiation. Data is representative of 4 independent experiments carried out in octuplicate. (C–E) Clonogenic assay in SH-SY5Y cells transfected with 1 μM of the indicated ODN and treated with the DNA damaging agent. In (D and E), results are expressed relative to the control mock-treated cells for each ODN, and data represent the mean±S.E.M. of 4 independent experiments performed in cuadruplicate. P-values were calculated using one-way ANOVA with Dunnett's posttest in (D) and Student's t-test in (E): *P < 0.05, **P < 0.01, ***P < 0.001, n.s. not significant. DO, decoy oligodeoxynucleotide.

