Figure 3.

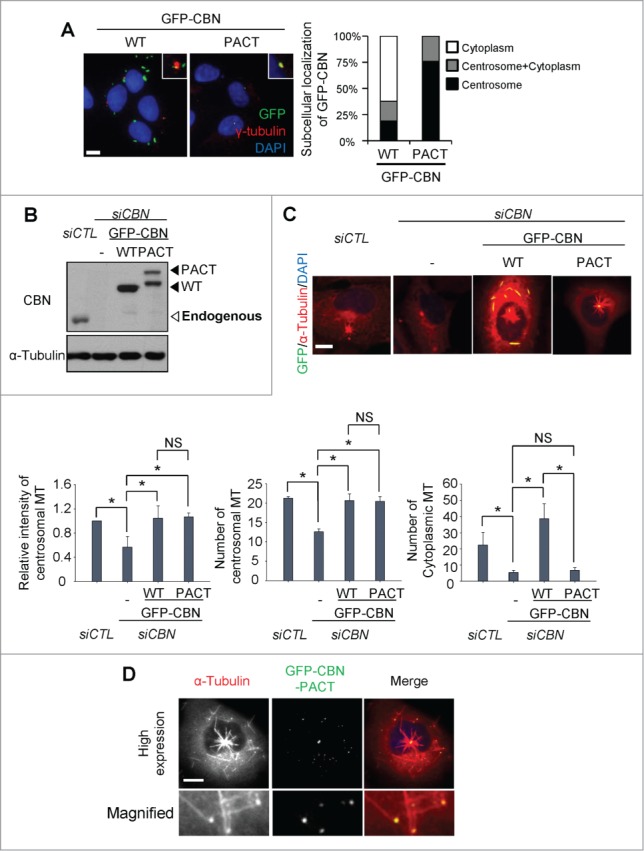
Microtubule regrowth assays with centrobin-PACT. (A) Immunostaining analysis was performed to determine subcellular distribution of GFP-CBN and GFP-CBN- PACT in U2OS cells. The cells were coimmunostained with the GFP (green) and γ-tubulin (red) antibodies. Nuclei were stained with DAPI (blue). Insets are magnified views of the centrosomes. Scale bar, 10 μm. The number of cells with cytoplasmic and/or centrosomal signals of ectopic GFP-CBN was counted. (B) Immunoblot analysis of centrobin was performed with the centrobin-depleted U2OS cells rescued with GFP-CBN and GFP-CBN- PACT. (C) Microtubule regrowth assays were performed with the centrobin-depleted cells rescued with GFP-CBN or GFP-CBN-PACT. The cells were coimmunostained with the GFP (green) and α-tubulin (red) antibodies. Scale bar, 10 μm. The intensity of centrosomal microtubules, the number of microtubules from centrosome, and the number of microtubules at the cytoplasm were quantified at the 10-second time point. At least 30 cells per an experimental group were measured in each of 3 independent experiments. Data show the mean±s.d.. *P < 0.05, in comparison to the centrobin depleted cells. (D) Immunostaining analysis was performed with centrobin-depleted U2OS cells rescued with an excess amount of GFP-CBN-PACT. The magnified view shows the regrown microtubules from the cytoplasmic centrobin. Scale bar, 10 μm.
