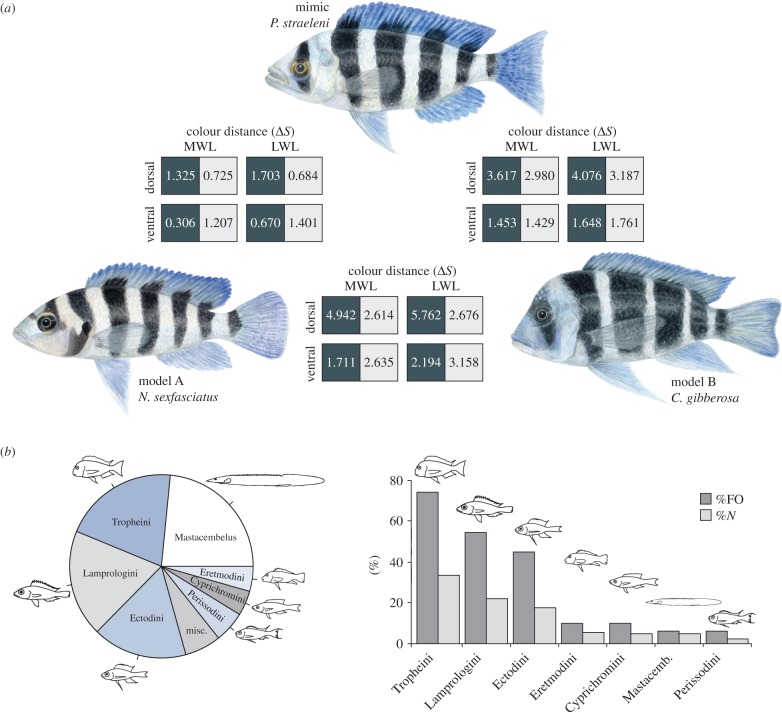
Figure 1.
(a) The mimic P. straeleni; the models N. sexfasciatus (model A) and C. gibberosa (model B) (drawings by Lucretia Ehrensperger). Colour distances ΔS between each pair and the four body regions (dark bars, light bars, dorsal and ventral) from the perspective of typical Tanganyikan-cichlid long and middle wavelength visual systems [16] are denoted. Dark and light squares show ΔS for dark and light bars between species. MWL: middle wavelength; LWL: long wavelength. Note that mimic–model pairs appear more similar (smaller values) to one another than the model–model pair. (b) Prey spectrum of P. straeleni in relative frequency across all scales identified in stomachs (diagram to the left). %FO: frequency of occurrence of prey; %N: average per cent number (average representation of a given prey within one stomach). Outlined fishes are the most representative species within each tribe.

