
Figure 4.
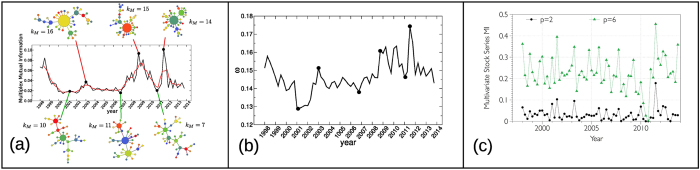
(a) The multiplex mutual information is a suitable quantity to detect global changes of behavior in multivariate financial time series. In the plot we report the value of the average information (the red line is the corresponding running average) computed from the multiplex networks constructed from price time series of 35 major assets in NYSE and NASDAQ in each 3-month period between January 1998 and December 2013 (see Methods for details). Notice that the most pronounced peaks of mutual information correspond to periods of major financial instability (the .com bubble in 1998–1999, the mortgage subprime crisis in 2007–2012). The Maximum Spanning Trees of the corresponding networks of layers (six typical examples are shown), always include a large hub during crises (the three top networks), whose degree kM is larger than the maximum degree observed in periods of stability (the three bottom networks). Each asset is assigned the same color in all the networks, while the size of a node is proportional to its degree. (b) The difference between periods of stability and crises is also detected by the average edge overlap ω. For visual reference, we report in the plot the six example points examined in panel (a). It is evident that peaks of ω correspond to crises while dips are usually associated to normal market activity. (c) The mutual information among the same set of time series performed after a standard symbolization with p symbols is not able to single out crises. The resulting signal is much more herratic and not as informative as the multiplex mutual information shown in panel (a).