Figure 1.
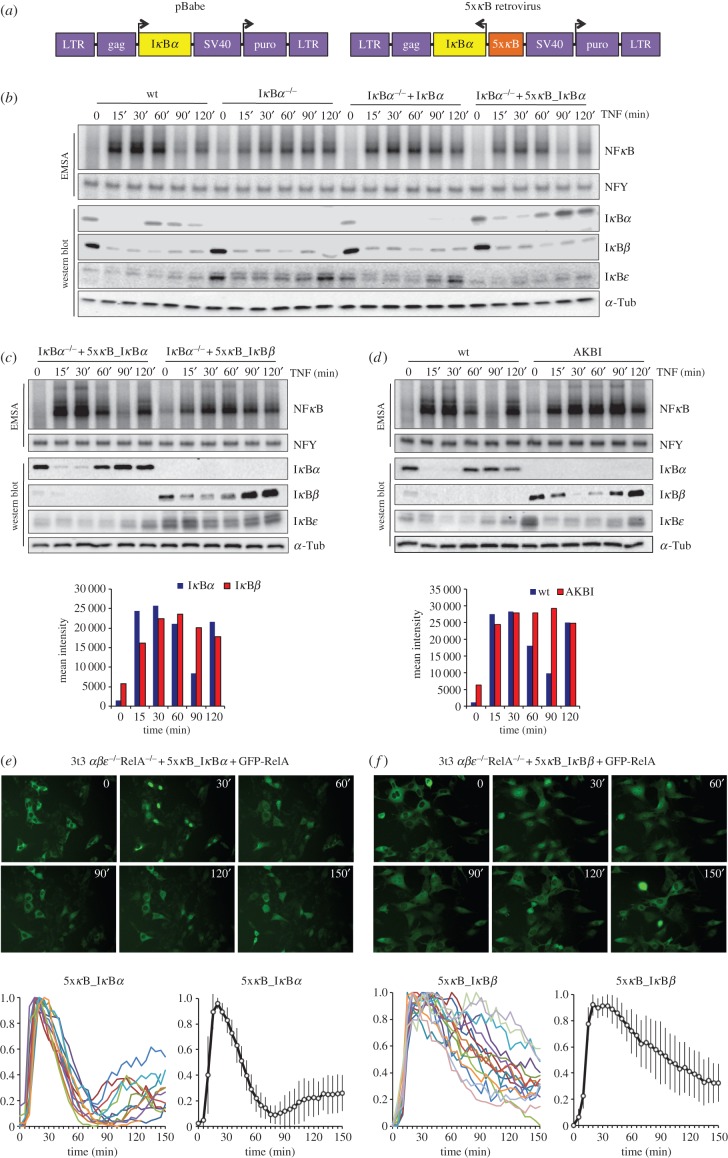
NFκB-dependent transcriptional control is not sufficient for IκB negative functions. (a) Schematic diagram of pBabe and 5xκB retroviral expression constructs consisting of a tandem repeat of 5xκB sites driving the expression of IκBα. (b) Electrophoretic mobility shift assay (EMSA) and immunoblot analysis of wt, IκBα−/−, IκBα−/−+ pBabe_IκBα, and IκBα−/−+ 5xκB_ IκBα murine embryo fibroblast (MEF) cell lines. EMSA indicates NFκB activity over a 120 min time course after stimulation with 1 ng ml−1 of TNF; NFY binding was used as an EMSA control. Western blot shows protein abundances for IκBα, IκBβ and IκBε with α-tubulin as a loading control. (c) IκBα−/− MEFs reconstituted with NFκB-inducible IκBα or IκBβ were treated with 1 ng ml−1 of TNF and nuclear extracts analysed by EMSA for NFκB binding activity; NFY binding was used as an EMSA control. Immunoblots of corresponding cytoplasmic fractions were probed with antibodies specific for IκBα, IκBβ and IκBε; α-tubulin was used as a loading control. Densitometric quantification of NFκB is presented as a bar graph below. (d) EMSA and immunoblot analysis of wild-type MEFs and MEFs that have the endogenous coding region for IκBα replaced by IκBβ knock-in (AKBI). Cells were treated with 1 ng ml−1 of TNF and nuclear extracts analysed by EMSA for NFκB-binding activity; NFY binding was used as an EMSA control. Immunoblots of corresponding cytoplasmic fractions were probed with antibodies specific for IκBα, IκBβ and IκBε; α-tubulin was used as a loading control. Densitometric quantification of NFκB is presented as a bar graph below. (e,f) NFκB nuclear localization at the single-cell level. IκBα−/−β−/−ε−/−RelA−/− MEFs reconstituted with AcGFP1-RelA and NFκB-inducible IκBs. (e) IκBα cells were treated with 10 ng of TNF and fluorescent images were captured every 5 min and cellular localization of AcGFP1-RelA was measured and plotted as a normalized nuclear to cytoplasmic ratio individually (bottom left colour traces) and as a combined average (bottom right black trace). (f) IκBβ cells were treated with 10 ng of TNF and fluorescent images were captured every 5 min and cellular localization of AcGFP1-RelA was measured and plotted as a normalized nuclear to cytoplasmic ratio individually (bottom left colour traces) and as a combined average (bottom right black trace).

