
Figure 3.
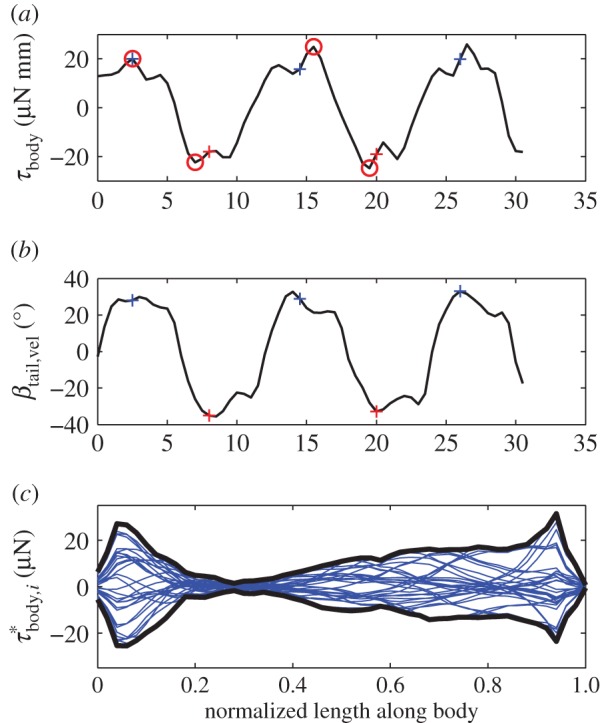
Body torque and angle-of-attack of the tail at 0.96 ℓbody for the episode in figure 1. (a) Instantaneous inertial body torque τbody (circles: selected extrema). (b) Angle-of-attack of the tail with respect to the velocity vector of the tail (βtail). The blue and red ‘+’ signs in panel (a) and (b) correspond to the minima and maxima in αbody (figure 2a). The time between two ‘+’ signs of the same colour represents a full tail-beat cycle. (c) Distribution of the contribution to τbody by the 51 body segments expressed as torque per unit length  . Each blue curve represents the torque distribution at a particular instant (at 1 ms intervals). The heavy black curves show the envelope. The narrowest location along of the ‘neck’ of the envelope corresponds to the location of the straight-body CoM.