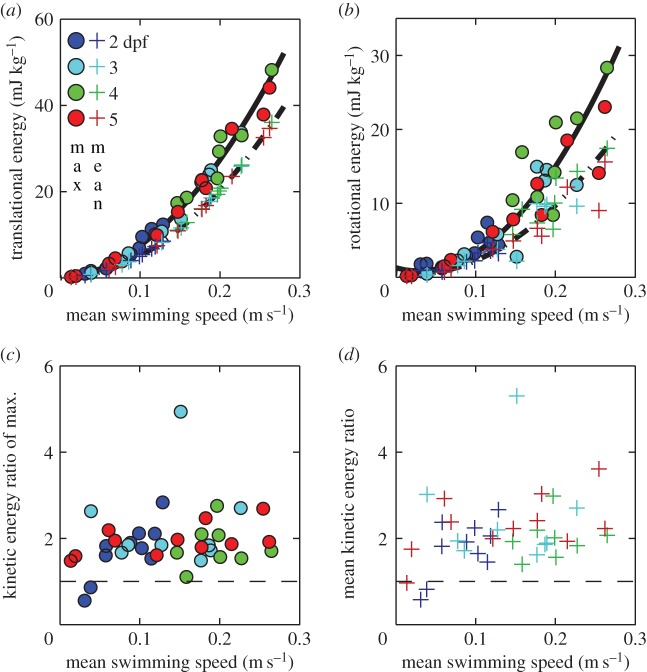
Figure 8.
Specific kinetic energy due to translation E*tr,CoM and rotation E*rot,body during (near-)cyclic swimming for the same dataset as figure 6. (a,b) Maximum (○) and mean (+) values against mean swimming speed  Second-order polynomial curve fits for maxima (continuous curve) and mean (dashed curve) are shown in (a,b). (c,d) Ratio of the maxima (c) and the means (d) of Etr,CoM and Erot,body over
  . The horizontal dashed line indicates a ratio of 1. Parameter values for each curve fit in (a) and (b) are given in electronic supplementary material, table S4.

