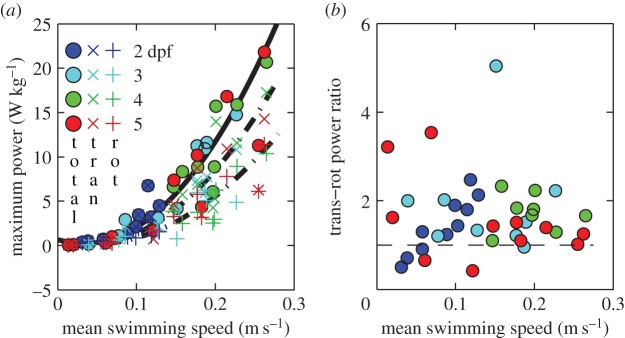
Figure 9.

Maximum specific power computed as rate of change of kinetic energy of the body per body mass during (near-)cyclic swimming for same dataset as figure 6. (a) Total (○), translational (×) and rotational (+) power over mean swimming speed. Second-order polynomial curve fits for maximum total (continuous curve), and translational, and rotational (dashed curves) powers are shown. (b) Ratio of maximum translational to rotational power. The horizontal dashed line indicates a ratio of 1. Parameter values of the curve fits in (a) are given in electronic supplementary material, table S4.
