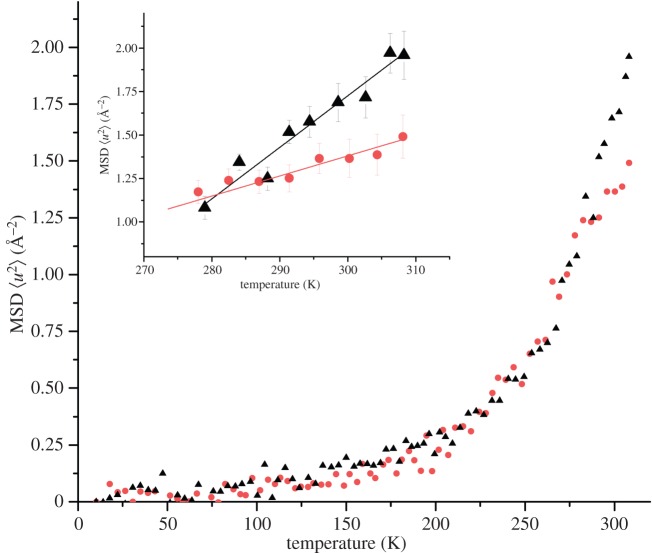
Figure 7.
EINS data indicates a difference in protein flexibility when in free and nanocluster form. MSDs as a function of temperature of OPN 1–149 (black triangles) and OPN CPN (dots), hydrated to 0.44 g D2O per gram of protein, from IN16 neutron spectroscopy data. Inset: effective force constants were extracted from the highlighted slopes above 270 K. (Online version in colour.)

