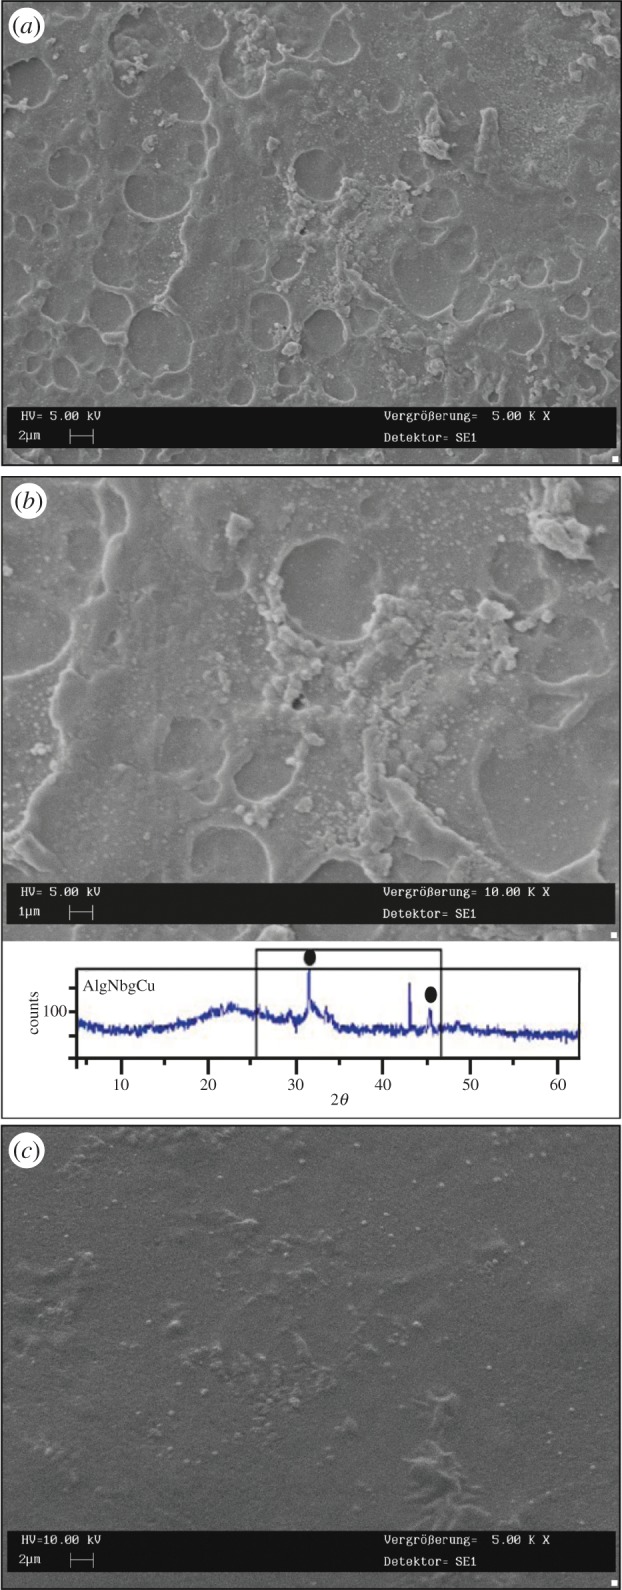
Figure 5.

SEM pictures showing crystals formed on the surface of 2D scaffolds after 7 days of immersion in SBF: (a) low magnification (sample: AlgNbgCu); (b) high magnification. The bottom part of the image shows the XRD spectrum where sharp peaks at 31.8° and 46.7° could be attributed to HA crystals on the surface of the nanocomposite 2D scaffolds after 7 days in SBF (sample: AlgNbgCu). Similar results were obtained for AlgNbgCa. (c) Any crystals were observed on the surface of 2D scaffolds without Nbg (sample: AlgCu). (Online version in colour.)
