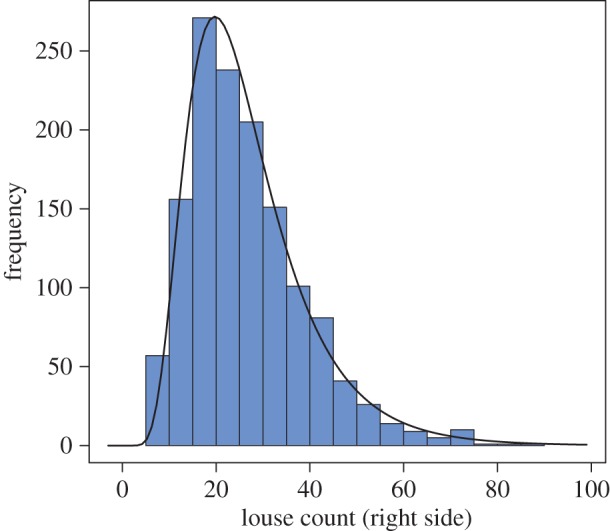
Figure 2.

Frequency distribution of number of lice counted from right side of salmon only (blue bars) with corresponding lognormal distribution overlaid (line). The distribution of lice counts is right skewed. Most fish have relatively low counts but a small number of fish have high counts. A total of 1405 fish were examined.
