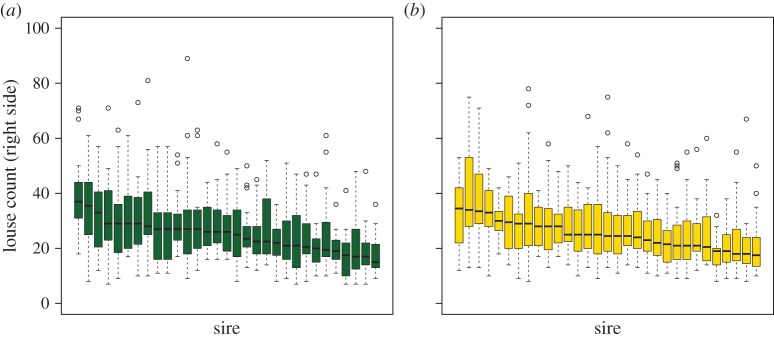
Figure 4.

The median number of lice counted from 31 sire families at (a) 7 dpi and (b) 17 dpi, with families arranged in order of susceptibility from least susceptible to most susceptible. Box plots show the median (thick horizontal line), interquartile range (box), minimum and maximum values excluding outliers (whiskers) and outliers (circles) of the number of lice for each sire.
