Figure 1.
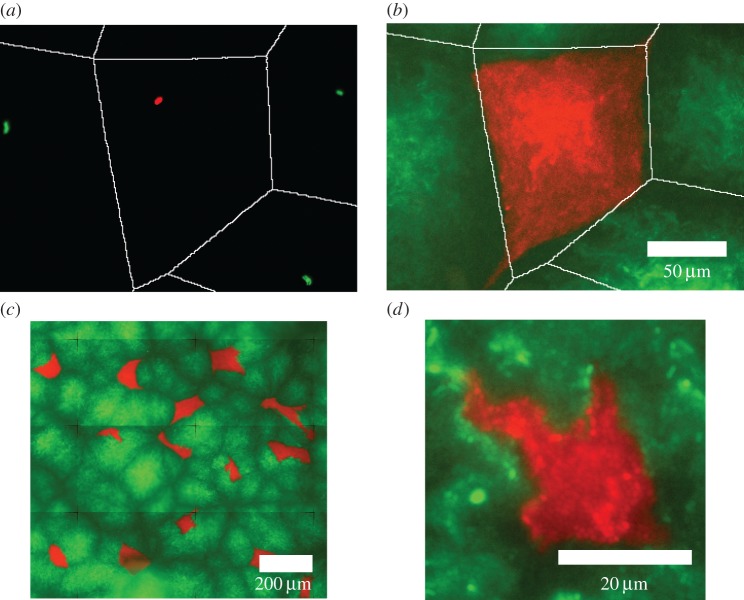
In our experiments, E. coli cells expressing two different fluorescent labels proliferate and compete for space. Cells expressing either cyan (CFP) or yellow fluorescent protein (YFP) are shown here as false colour red and green, respectively, to aid visual contrast. (a) An initial configuration of progenitor cells on the surface; Voronoi polygons (white lines) are generated based on the positions of the progenitor cells. (b) A patch that results from the proliferation of one of the individual cells shown in (a); the surrounding patches are green (YFP rather than CFP), so do not appear on this image. (c) A montage of several microscope fields of view, showing how a complete picture of the colonized surface can be built. The red patches in these types of image are analysed to produce the results presented in this paper. Variations in fluorescence intensity are caused by variation in cell density across the agarose surface. (d) A detail of a patch arising in an experiment with an initially higher cell density, which shows a less uniform patch shape. In all images, the brightness levels have been adjusted in ImageJ for clarity.

