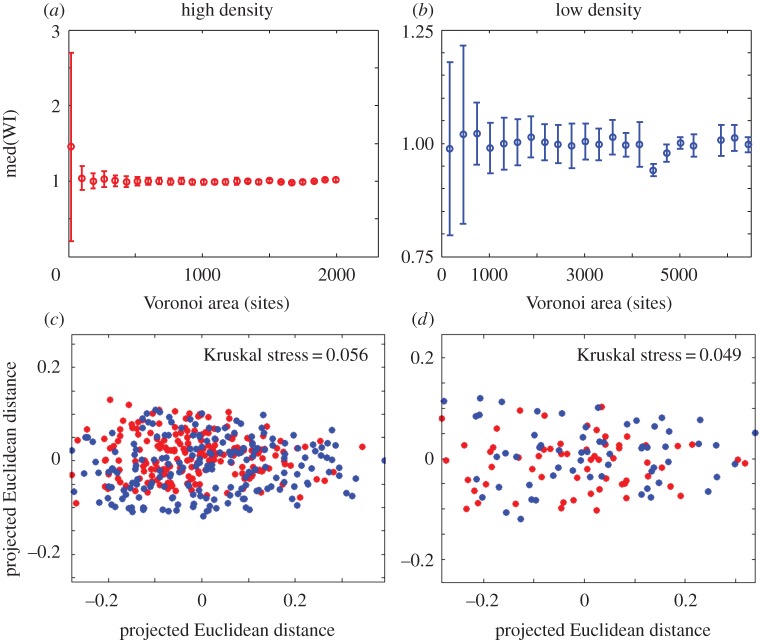
Figure 11.
Simulations without lag times in the perimeter growth regime do not show significant effects of patch area or shape on the WI. (a,b) Median WI values are plotted as a function of binned Voronoi polygon area, for simulations with 400 (a) and 100 (b) founder cells. (c,d) MDS plots show the similarity between Fourier spectra of Voronoi polygons in the top (blue, ‘winners') and bottom (red, ‘losers') 10% of the relevant WI distributions, for simulations with 400 (c) (N = 394) and 100 (d) (N = 120) founder cells; the Kruskal stress measures the degree of agreement between the distances shown on the plots, and the actual computed distances. In both cases, clustering among the red and blue points is not statistically significant (PERMANOVA: p = 0.135 for high founder cell density and p = 0.202 for low founder cell density).

