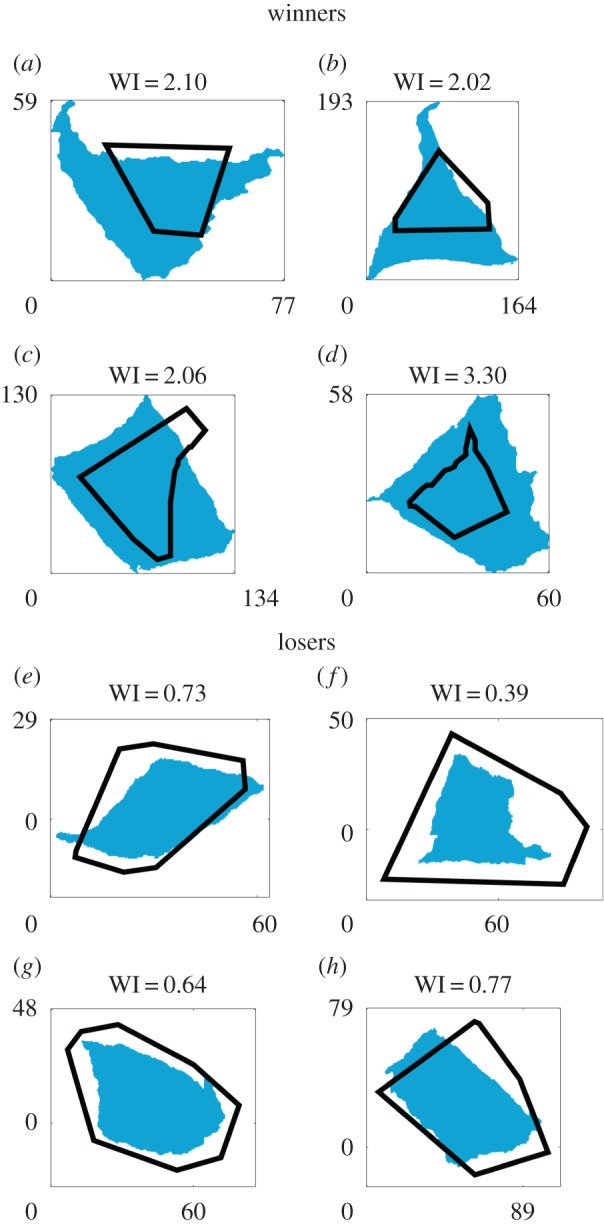
Figure 2.

Shapes of selected patches resulting from ‘winner’ (a–d) and ‘loser’ (e–h) cells (blue), together with the shapes of their Voronoi zones (black lines) and their WI values. The blue shapes are obtained by thresholding the fluorescent images obtained after colonization. These results are taken from the low cell density experiment (ρlow = 1.5 × 10⁻⁴ cell µm−2). Axes labels are micrometres.
