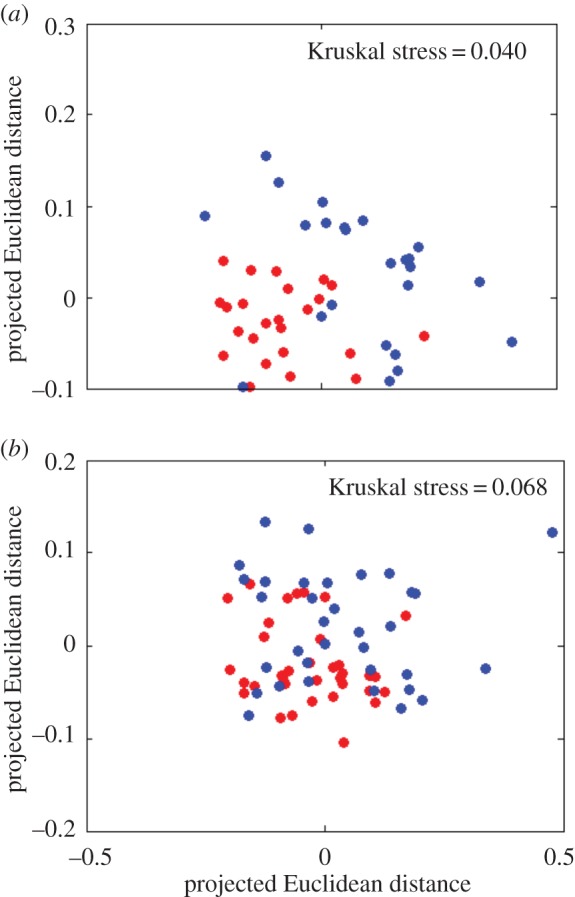
Figure 6.

Founder cells that go on to be winners are statistically different in Voronoi patch shape from those that go on to become losers. MDS plots provide two-dimensional projections of the matrix of differences in Fourier descriptor spectra among individual Voronoi patches; the Kruskal stress measures the degree of agreement between the distances shown on the plots, and the actual computed distances. Red points represent cells that go on to be losers (bottom 10% of the WI distribution), and blue points those that go on to become winners (top 10% of the WI distribution). Distinct clusters of red and blue points indicate distinct typical Voronoi patch shapes for losers and winners. The statistical significance of this clustering was analysed by PERMANOVA (see Methods). (a) Results for high initial cell density, N = 48 (clustering significance by PERMANOVA: p = 0.001). (b) Results for low initial cell density, N = 70 (clustering significance by PERMANOVA: p = 0.008).
