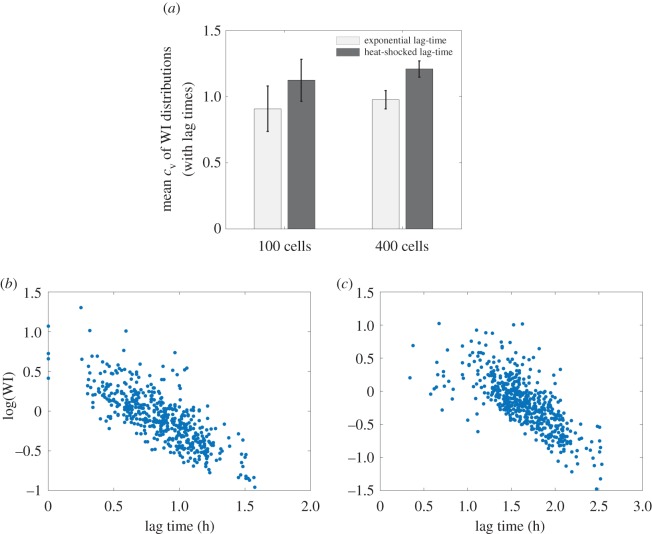
Figure 7.
A broader lag-time distribution produces a broader winner index distribution, in our simulations as in our experiments. The lognormal coefficient of variation (cv) of the WI histograms is shown for simulations using different lag-time distributions and initial seed cell densities. Using the heat-shocked lag-time distribution (taken from our experimental data, figure 4b) results in a wider WI distribution than using the exponential lag-time distribution (figure 4a, two-way ANOVA p < 0.01). This result holds for two different founder cell densities, 100 initial cells (i.e. 4 × 10⁻⁴ cells per site) and 400 initial cells (i.e. 1.6 × 10⁻³ cells per site), although cell density did not affect mean cv values for the same lag-time distribution (two-way ANOVA p = 0.12). In all cases, simulations are performed in the exponential area growth regime. (b,c) Log(WI) versus lag time for individual cells in our simulations, where the lag times assigned to each cell have been picked from an experimentally determined distribution. The lag times assigned in this case are ones measured in cells that had been picked from liquid culture while still in the exponential phase (b), or heat-shocked while in stationary phase (c) before being spread on an agarose surface.

