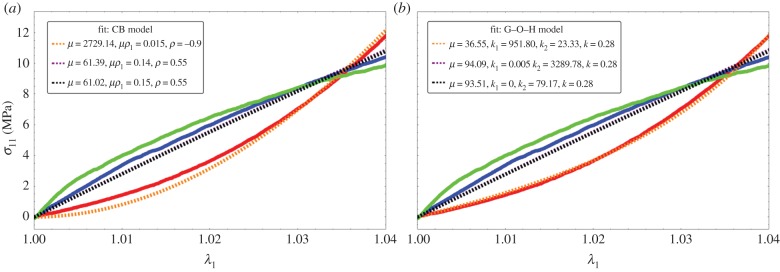
Figure 10.

Fitting values of the nominal stress in the CB model (a) and three-dimensional G–O–H model (b) corresponding to the experimental curves of figure 2b. Coloured lines are experimental results, black dotted lines correspond to the theoretical model with the best-fit parameters. Note the strong nonlinearities at low stretch values.
